
Posts Tagged ‘Television Marketing’
Americans & On Demand Entertainment, May 2013 [TABLE]
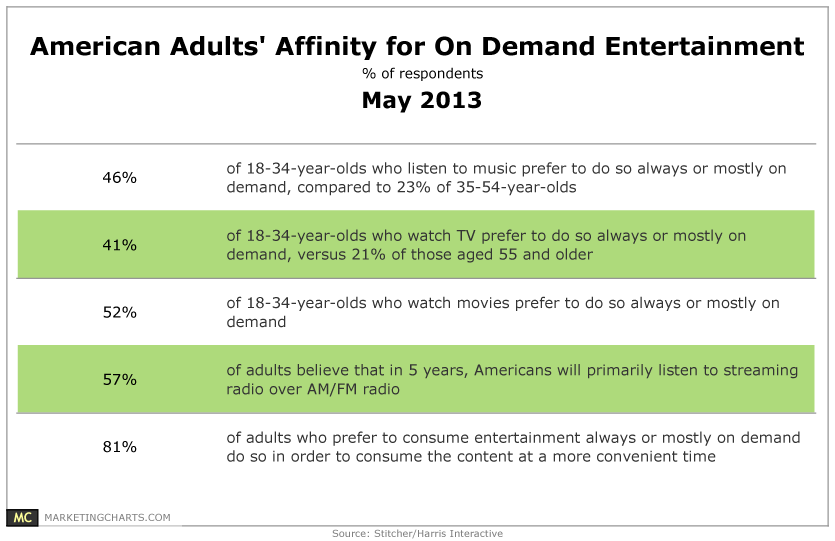
Americans aged 18-34 are more likely than their older counterparts to prefer a range of entertainment types on-demand.
Read MoreHow People Watch TV, May 2013 [CHART]

An average of just 44% of viewing of full-length TV shows is live.
Read MoreAmericans' TV & Video Media Consumption By Generation, Q2 2012 [TABLE]
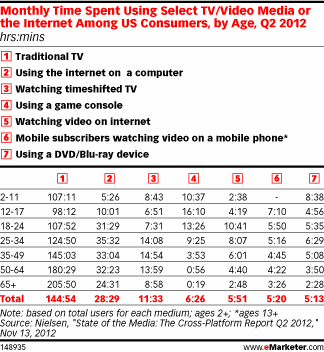
In Q2 2012, the average US mobile subscriber spent 5 hours and 20 minutes per month watching video on a mobile phone.
Read MoreDaily Time Media Consumption By Media, 2010-2012 [TABLE]
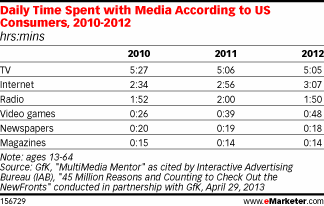
The average daily time spent online reached 3 hours, 7 minutes last year, up from just less than 3 hours in 2011.
Read MoreTime Spent On Multitainment Activity, April 2013 [TABLE]
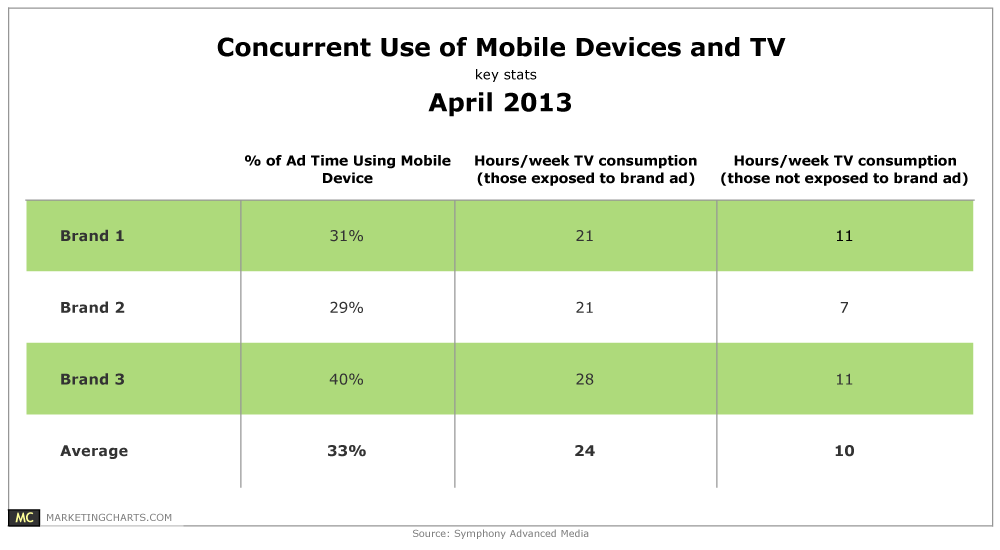
30-40% of actual TV ad viewing occurred concurrently with mobile device usage.
Read MoreBeyond Social Media: AP Twitter Hack, Kmart #ShipMyPants & Vibrating Underwear App [PODCAST]

This week: AP Twitterhacked; Kmart’s #ShipMyPants; April Blizzards; Boston Bombing Virtual Witch Hunts & Media Fails; Vibrating Underwear App; Amazon Originals; Cap’N Crunch Late Night; Rookie News Anchor Fail; Shiny New Stuff & Daily Numbers.
Read MoreNetwork TV Streaming & Pay TV, 2011 vs 2012 [CHART]
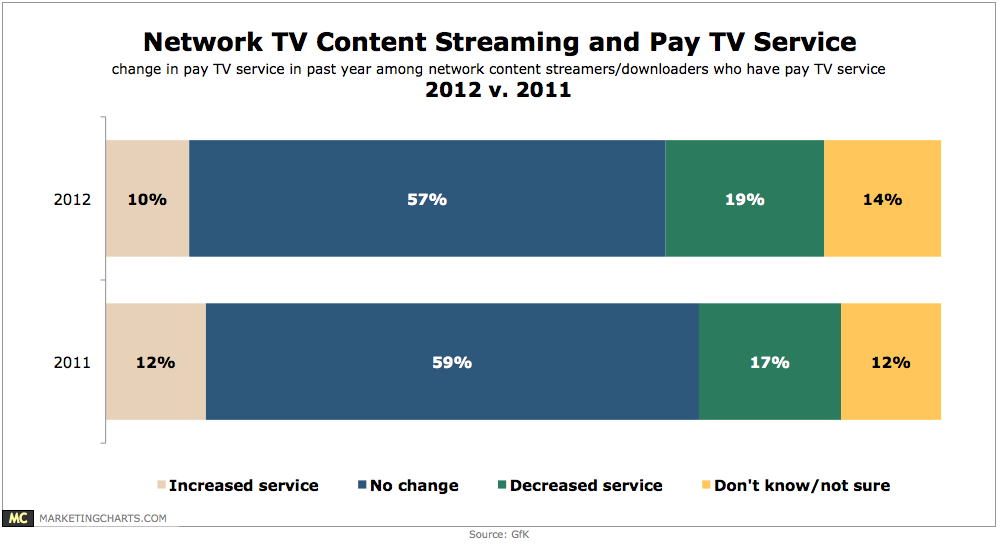
19% of TV video streamers and downloaders in 2012 reported decreasing service (“cord-slicing”) in the past year.
Read MoreHow People Watch Time-Shifted TV By Demographic, February 2013 [TABLE]
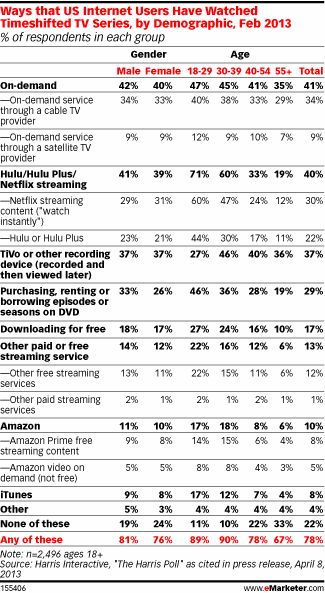
Nearly eight out of 10 US adult internet users watched TV on their own schedule.
Read MoreBinge TV Viewing By Generation & Gender, April 2013 [CHART]
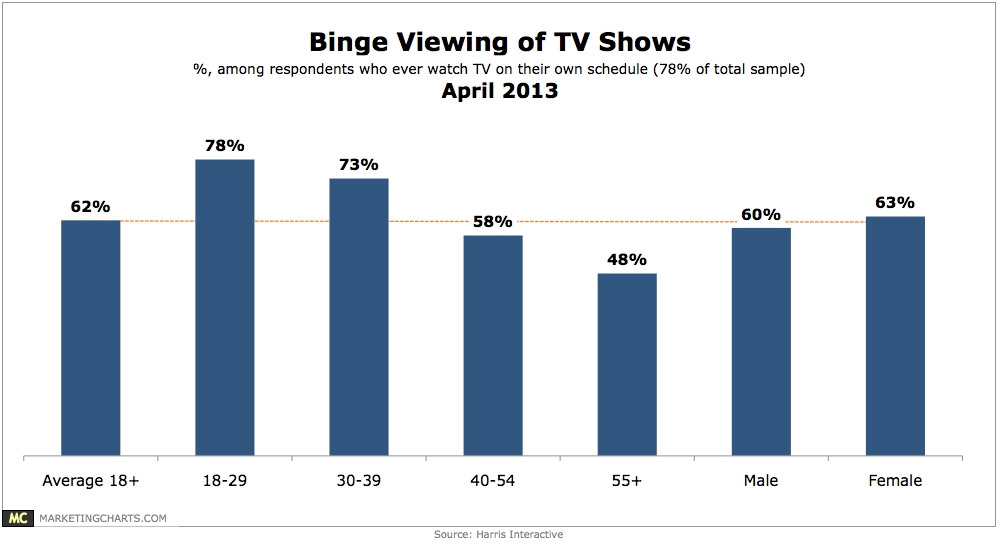
78% of Americans have watched TV on [their] own schedule and 62% of those have watched multiple episodes of a TV show at a time.
Read MoreSecond Screen TV-Related Behavior, April 2013 [CHART]
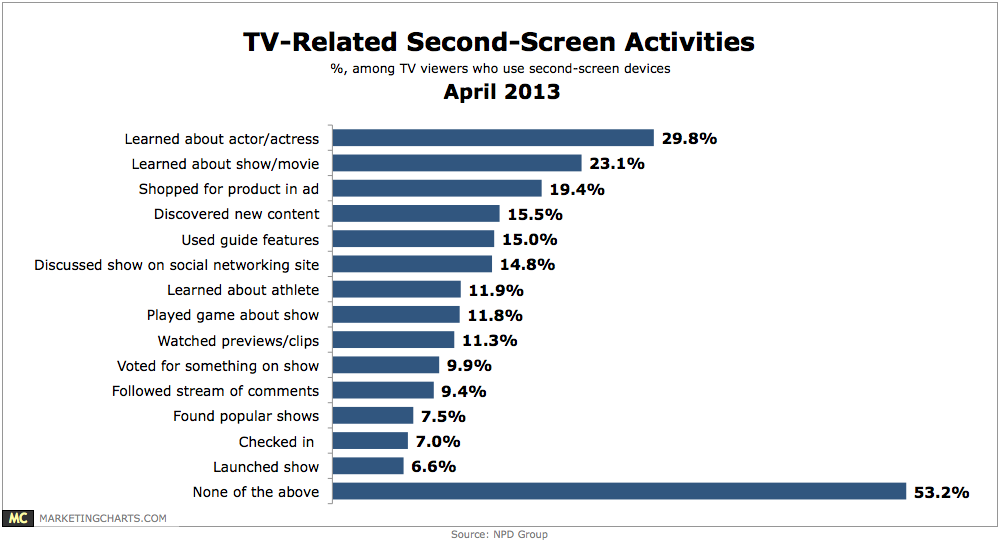
Among the most common is shopping for a product seen in an ad, by 19.4% of TV watchers who engage in second-screen activities.
Read More