Posts Tagged ‘Sports Marketing’
TV Screen Use [CHART]
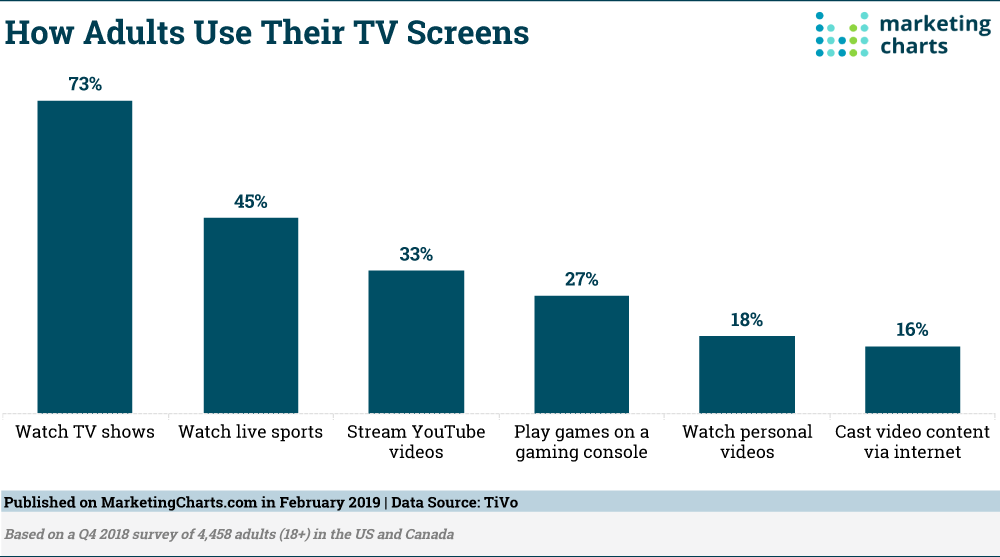
While TV devices have often been seen as a form of ‘traditional’ media by marketers, the reality is that some three-quarters of US households have an internet-connected TV.
Read MoreUS Sports Viewers By League [CHART]
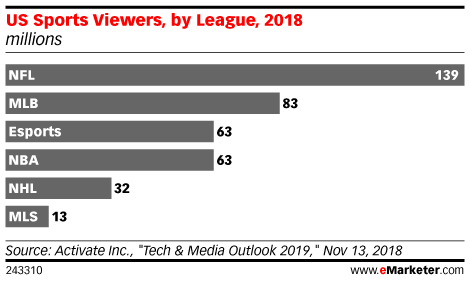
The US esports audience isn’t likely to reach Super Bowl proportions any time soon, but with viewer numbers expected to top 46 million in 2023, per eMarketer’s latest forecast, this is a large and growing segment of the sports entertainment ecosystem.
Read MoreGoogle Search vs Facebook Article Referral Traffic By Category [CHART]
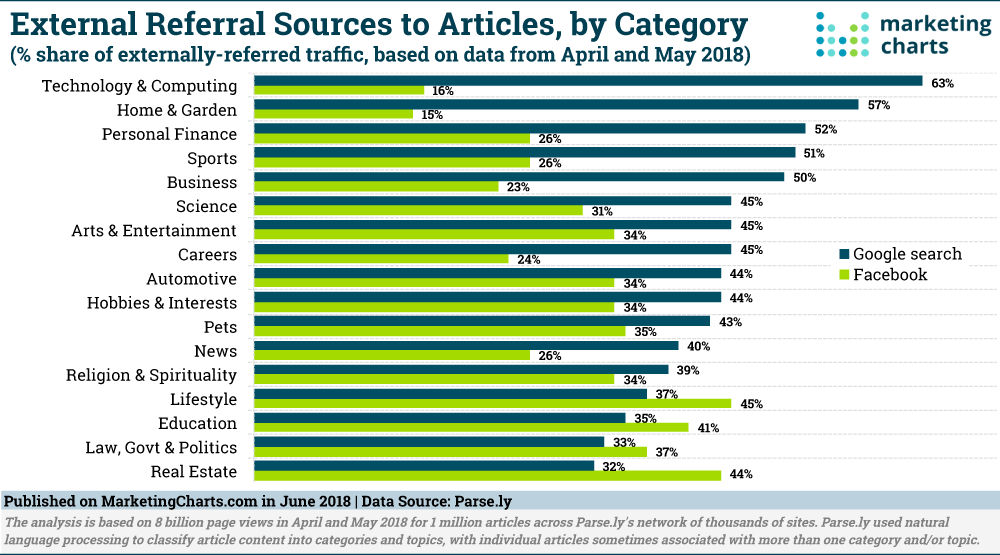
Google took the lead over Facebook last year in referrals to media sites. An analysis from the firm delves into the major referrers by article category, finding that Google search is a bigger referrer than Facebook for most.
Read MoreSocial Television Appeal By Generation [CHART]
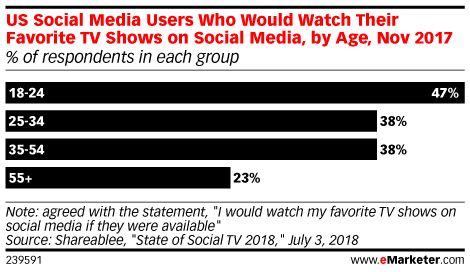
Long-form video is spreading across social media. With the launch of IGTV, Instagram joined Facebook, Snapchat and Twitter in a space getting more crowded by the day.
Read MoreOut Of Home TV Viewing By Generation [CHART]
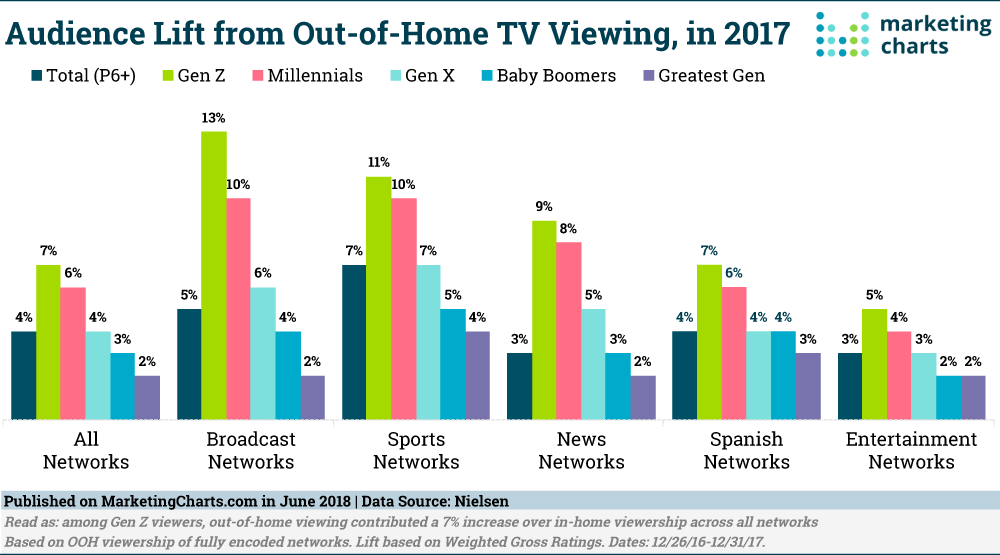
Young people are watching less traditional TV in the home – that much is clear. But data from Nielsen indicates that they haven’t abandoned their interest in linear TV.
Read MoreFacebook Video Interactions By Topic [CHART]
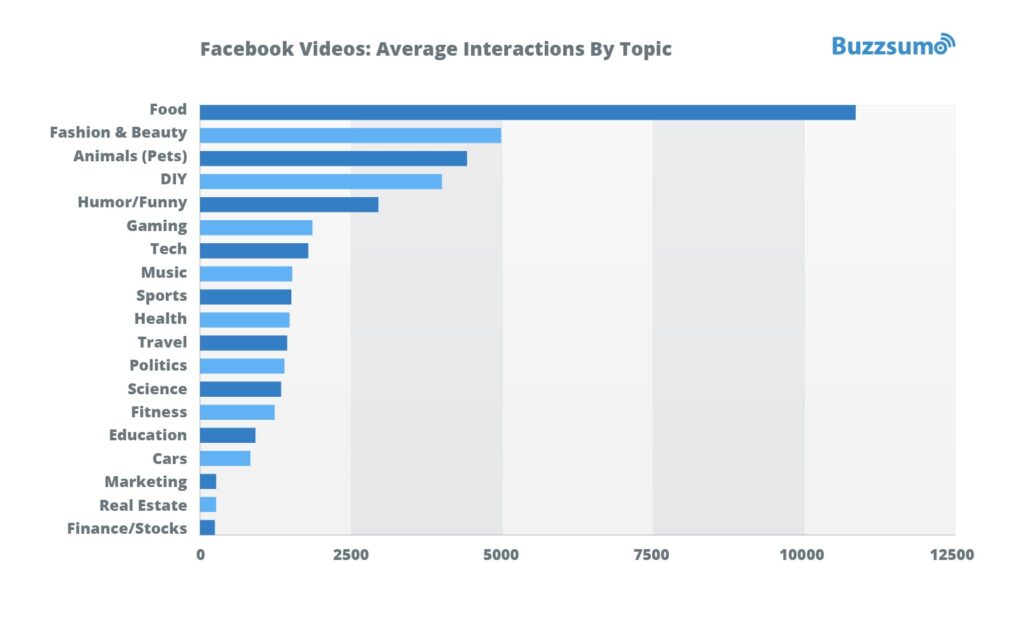
Buffer partnered with BuzzSumo to analyze more than 43 million posts from the top 20,000 brands on Facebook in one of the largest studies of 2018. The most enaging topics posted as video content to Facebook include food, fashion and beauty, animals, do-it-yourself, and humor. The least engaging topics include finance and stocks, real estate, marketing and cars.
Read MoreMillennials' Video Genres
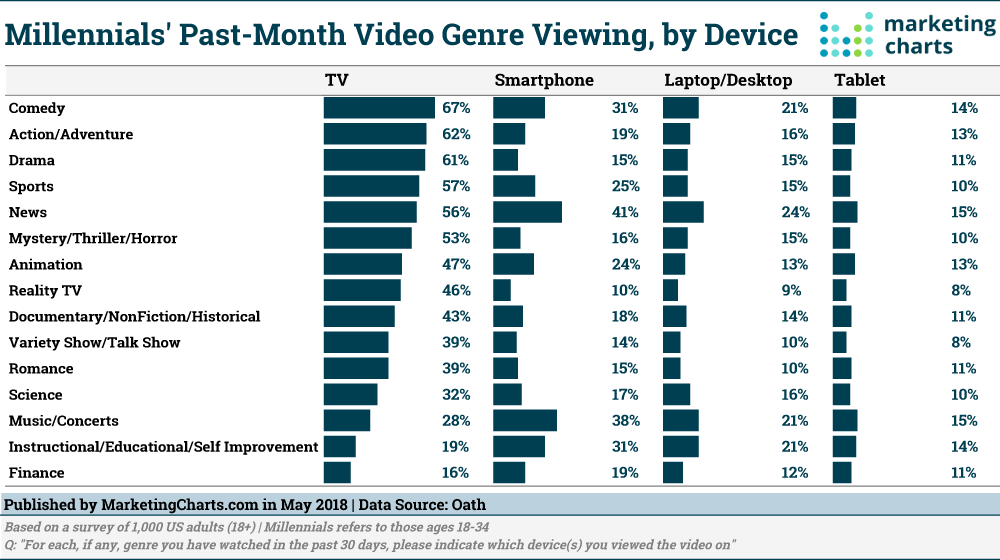
Millennials in the US generally watch Comedy, Action/Adventure and Drama on TV but gravitate to News first on digital devices, finds a report from Oath.
Read MoreIndustries Where VR Will Have The Most Impact [CHART]
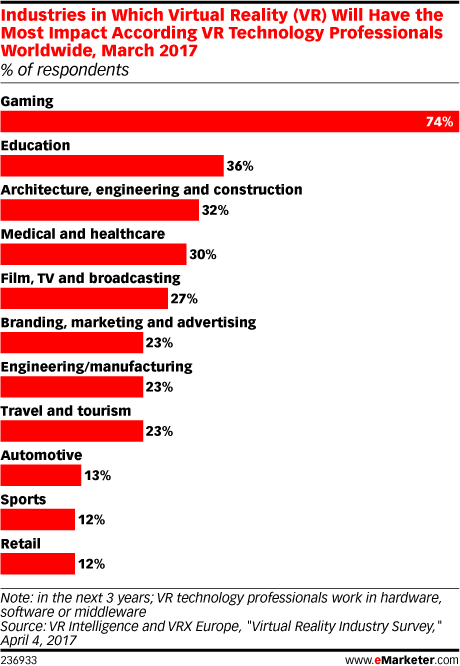
Despite the hype, it’s not yet clear if or when virtual reality (VR) technology will reach mass-market status. However, specialized applications are showing promise in a variety of industries.
Read MoreConsumer Trust By Industry [TABLE]
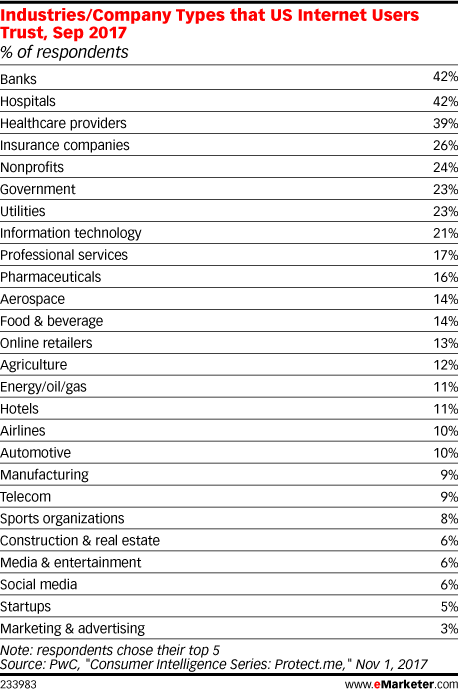
Consumers are more likely to trust banks—and even insurance firms—than marketing or advertising companies. That’s according to a September 2017 PwC survey, which found that just 6% of US internet users said they trusted media and entertainment companies.
Read MorePerceptions Of Gender Inclusivity [CHART]
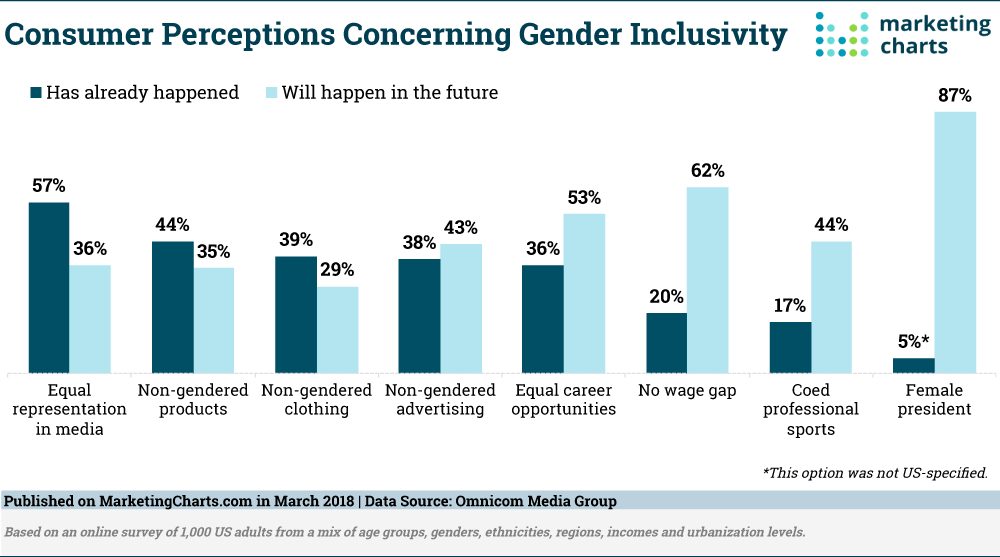
3 in 4 people in the US believe that traditional gender roles have changed. They don’t believe in stereotypes such as a woman’s primary role being the caretaker of the home or a man’s primary role as being the breadwinner.
Read More