Posts Tagged ‘mCommerce’
Americans Who Use Their Smart Phones In-Store By Generation, January 2014 [CHART]
The majority of US smartphone users in each age demographic studied used their phones at least sometimes while shopping in brick-and-mortar stores—and few felt guilty about it.
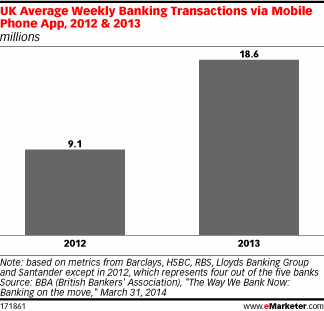
Read MoreUK Average Weekly Mobile Banking Transactions, 2012 & 2013 [CHART]
BBA found that the average number of mobile banking transactions conducted weekly via mobile app more than doubled between 2012 and 2013, from 9.1 million to 18.6 million.
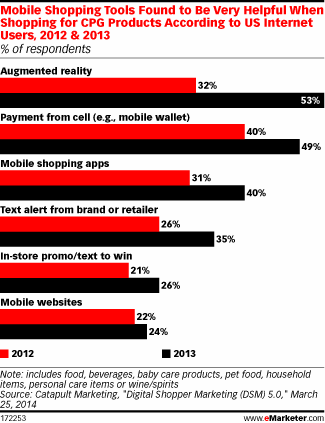
Read MoreHelpful Mobile Shopping Tools For CPG Product Shoppers, 2012 & 2013 [CHART]
The number of consumers using augmented reality will likely grow as marketers respond to the positive feedback from those who are using it.
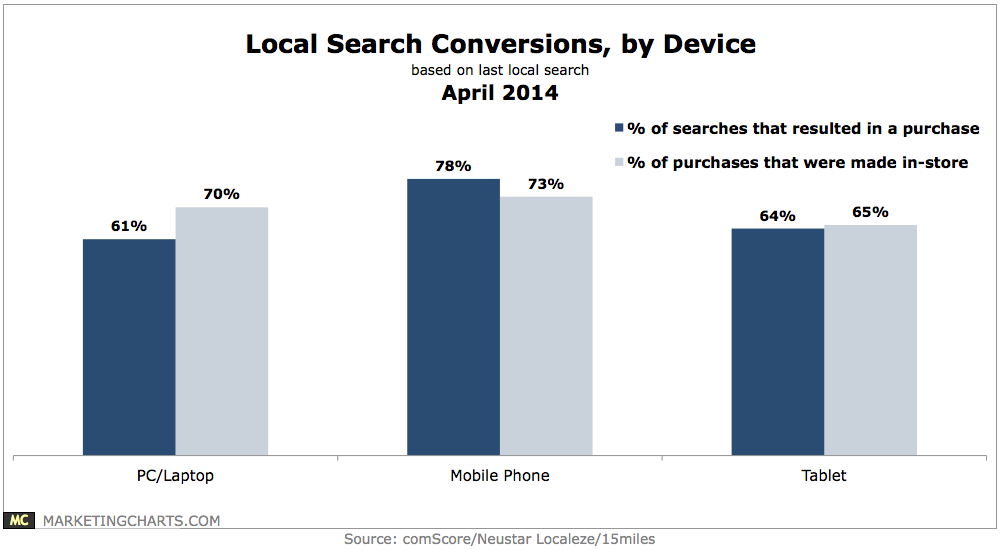
Read MoreLocal Search Conversions By Device, April 2014 [CHART]
Some 78% of local searches conducted on a mobile phone result in a purchase, and 73% of those purchases are made in-store.
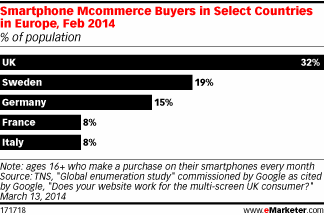
Read MoreMobile Commerce In Select European Countries, February 2014 [CHART]
A February 2014 study by TNS commissioned by Google found that 32% of the entire UK population ages 16 and up made purchases on their smartphones each month.
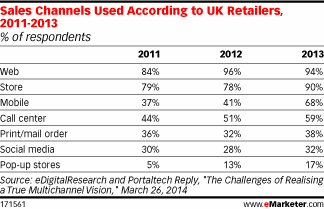
Read MoreSales Channels Used By UK Retailers, 2011-2013 [TABLE]
68% of UK retailers said they had a mobile presence in 2013, up from just 37% in 2011.
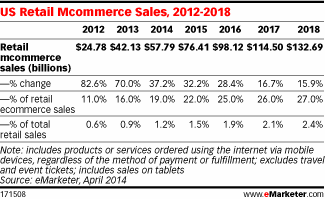
Read MoreUS Retail mCommerce Sales, 2012-2018 [TABLE]
In 2013, retail mCommerce—which includes products and services ordered on mobile devices, including tablets—increased 70.0% to reach $42.13 billion.
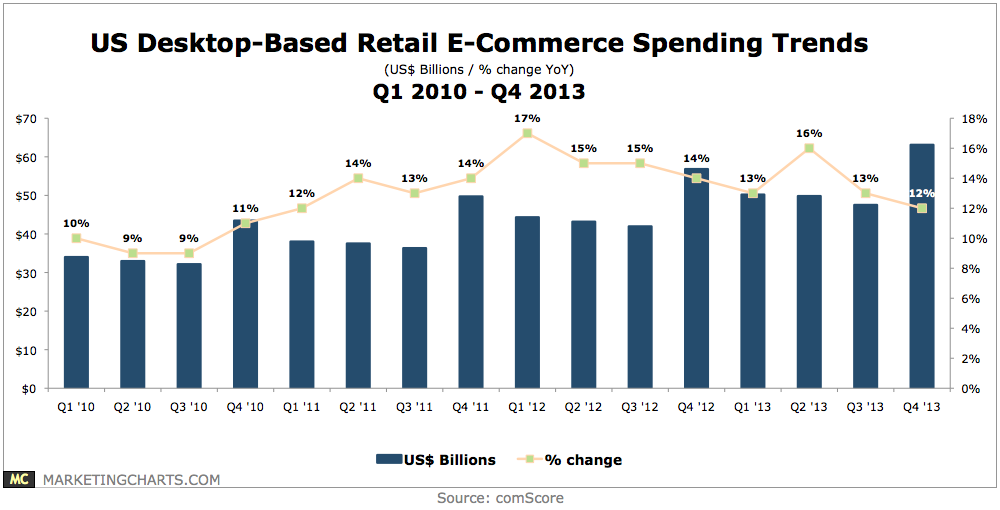
Read MoreUS Desktop-Based Retail eCommerce Spending Trends, Q1 2000-Q4 2013 [CHART]
Desktop-based e-commerce growth was 13% for 2013, though online retail’s growth overall was a point higher when factoring in mobile, which grew by 23% year-over-year.
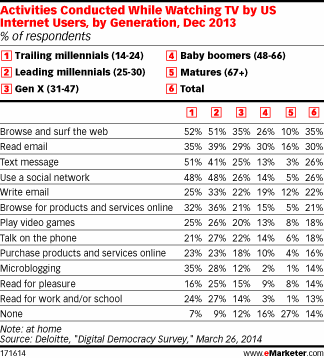
Read MoreSocial TV Activities By Generation, December 2013 [TABLE]
The Council for Research Excellence/Keller Fay Group found that millennials were the age group most likely to engage with social media while watching TV.
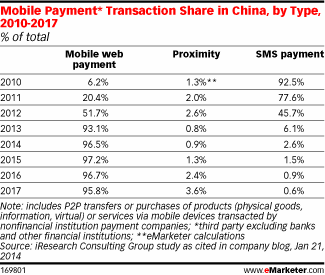
Read MoreMobile Payment Transaction Share In China By Type, 2010-2017 [TABLE]
Payments made via text message accounted for just 6.1% of mobile payment transactions in China during 2013, down from 92.5% in 2010.
Read More
