Posts Tagged ‘Automotive Marketing’
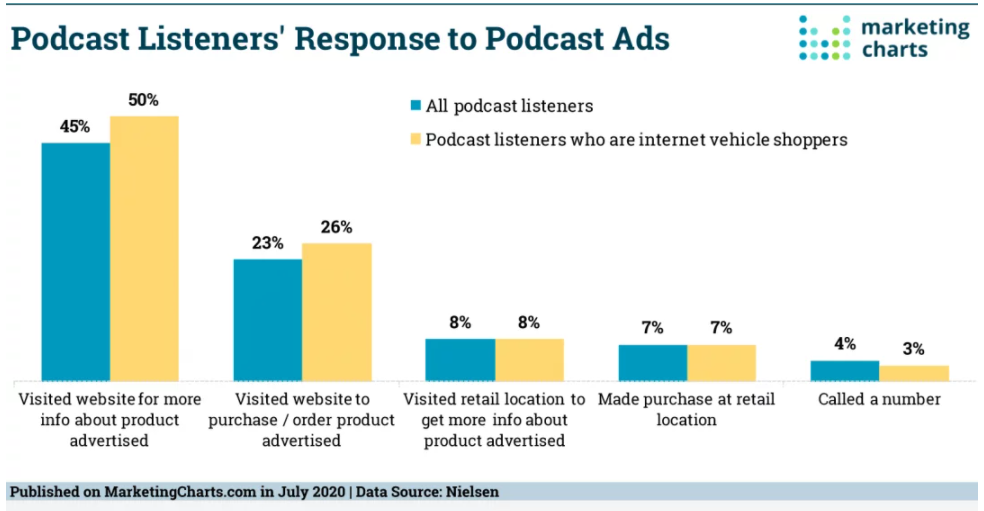
Podcast Listeners’ Response To Podcast Ads
Data from Nielsen explores how marketers in the auto industry, which has been hit particularly hard by the COVID-19 pandemic’s closure of plants and supply chains, could leverage an engaged audience of podcast listeners.
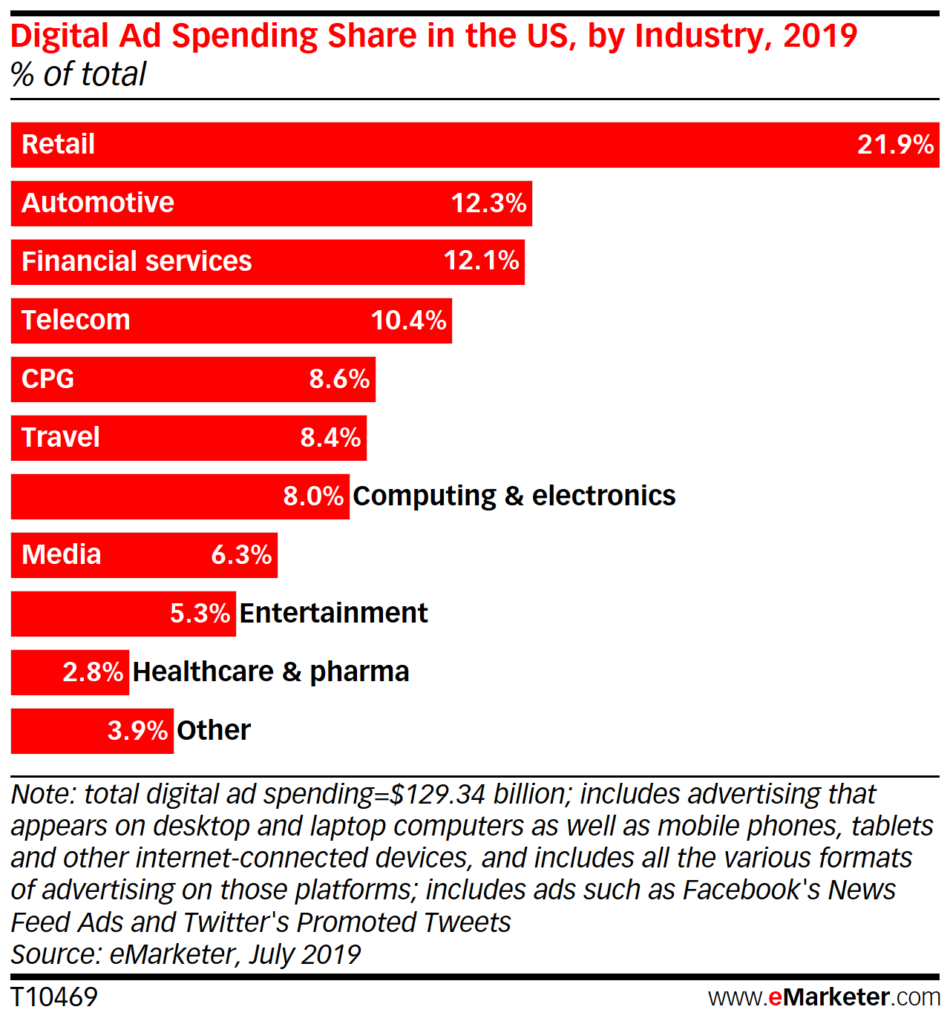
Read MoreDigital Ad Spending By Industry [CHART]
eMarketer expects a shift in US digital ad spending next year, as economic factors weigh on certain industries. In 2020, financial services will displace the auto sector, while travel will surpass consumer packaged goods (CPG).
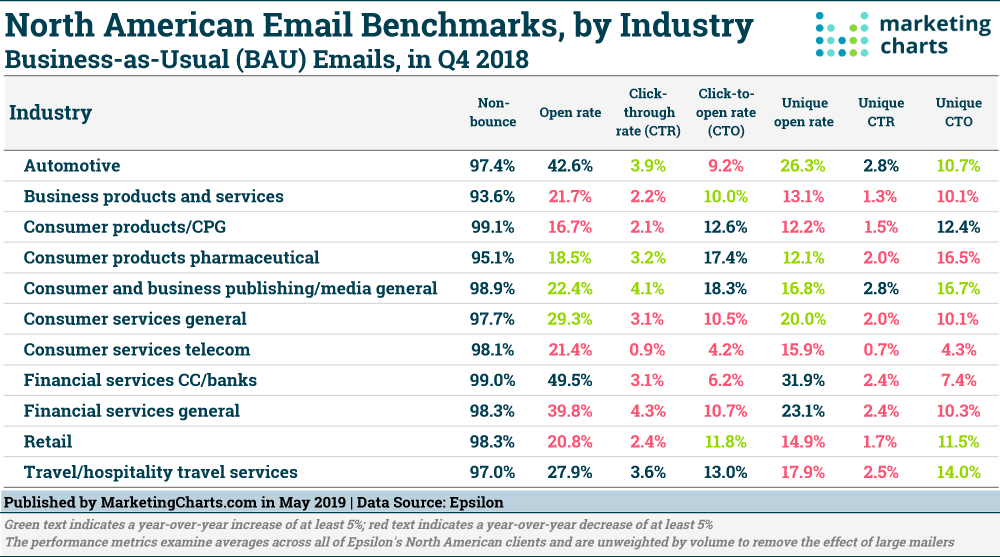
Read MoreEmail Benchmarks By Industry [TABLE]
Email click-through declined for business as usual emails in Q4 2018 on a year-over-year basis, per the latest email and benchmark trends report from Epsilon.
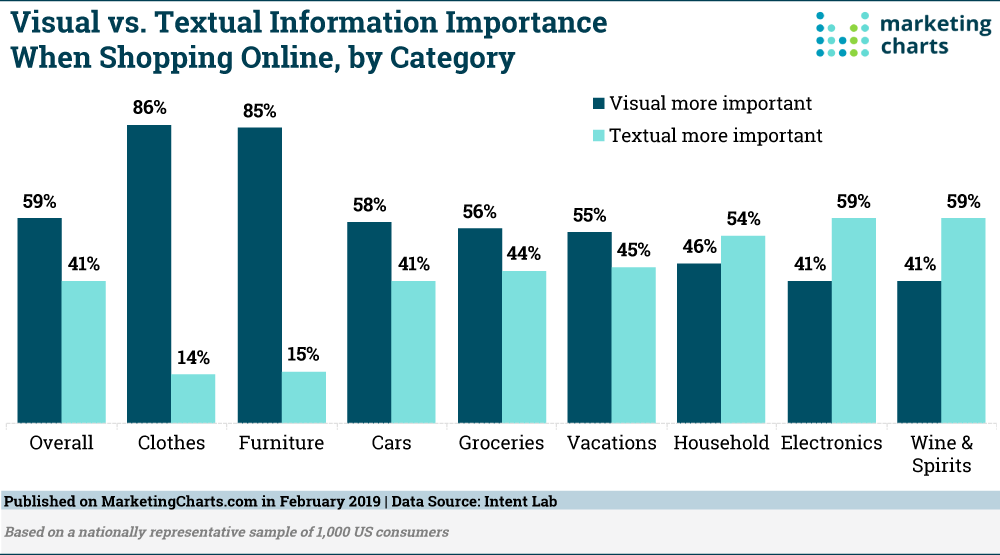
Read MoreVisual vs Text Information When Shopping Online [CHART]
More than one-third (36%) of US consumers have performed or used visual search when shopping online, a figure that matches the percentage who have used voice search.
Read More30 Instagram Stories Case Studies [INFOGRAPHIC]
This infographic from 99Firms illustrates thirty case studies of brands such as Mercedes-Benz, Lego, and E! News using Instagraph Stories.
Read MoreMobile Voice Search Behavior [INFOGRAPHIC]
This infographic from SERanking illustrates when, what, where, why and how of mobile search behavior.
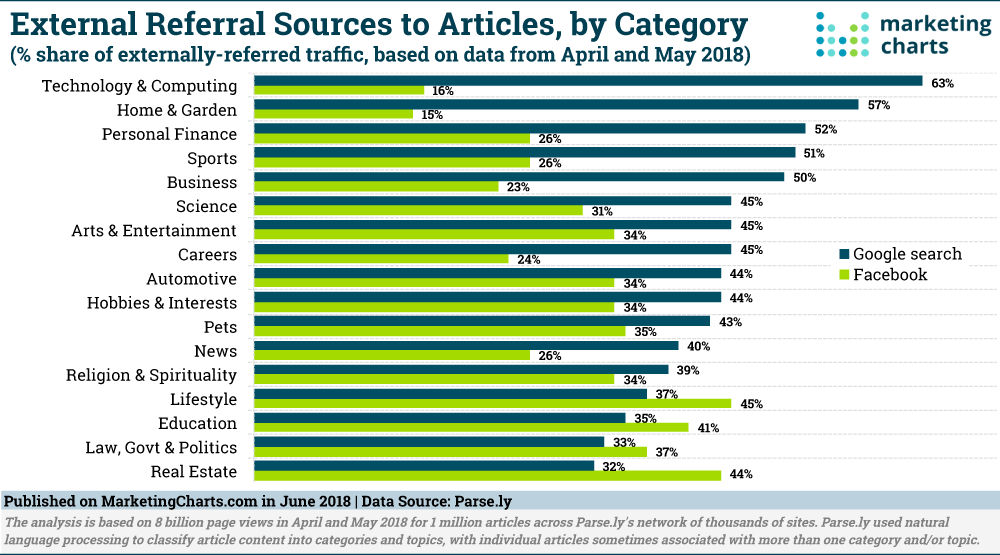
Read MoreGoogle Search vs Facebook Article Referral Traffic By Category [CHART]
Google took the lead over Facebook last year in referrals to media sites. An analysis from the firm delves into the major referrers by article category, finding that Google search is a bigger referrer than Facebook for most.
Read MoreInstagram Influence [INFOGRAPHIC]
This infographic from X-Cart illustrates the many ways in which Instagram is exerting its influence as a social media channel.
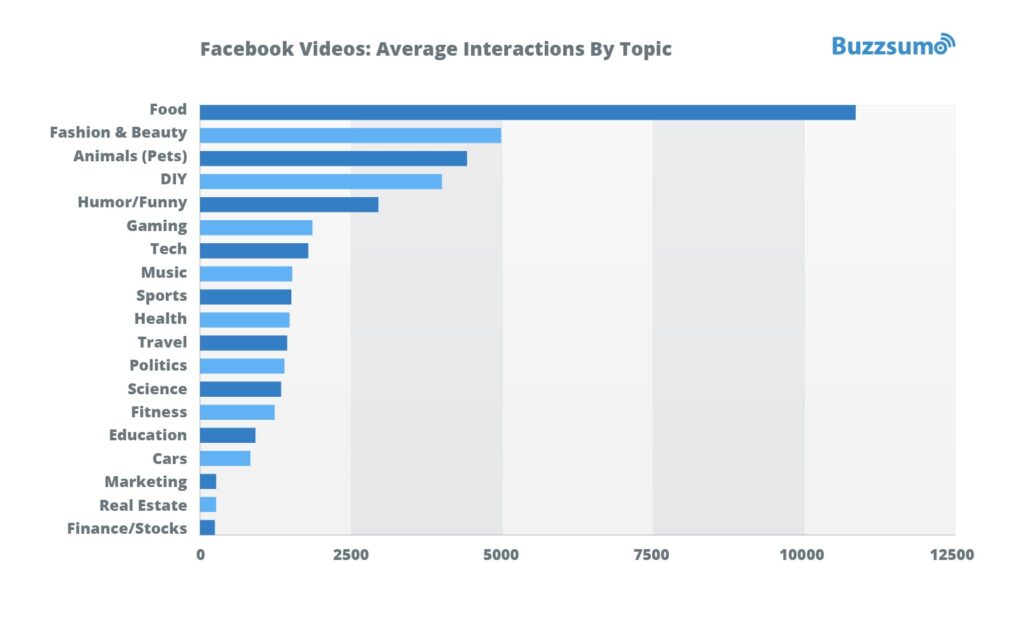
Read MoreFacebook Video Interactions By Topic [CHART]
Buffer partnered with BuzzSumo to analyze more than 43 million posts from the top 20,000 brands on Facebook in one of the largest studies of 2018. The most enaging topics posted as video content to Facebook include food, fashion and beauty, animals, do-it-yourself, and humor. The least engaging topics include finance and stocks, real estate, marketing and cars.
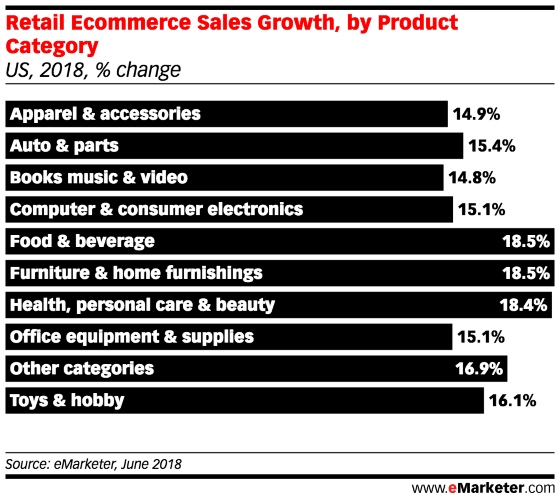
Read MoreeCommerce Sales Growth By Category [CHART]
Despite persistent gloom and doom surrounding the retail industry, the first half of the year has been positive for most product categories. According to the newly released monthly retail sales report from the US Census Bureau, for H1 2018, retail sales (excluding auto parts and gasoline) totaled $2.06 billion, up 4.9% year over year.
Read More