Posts Tagged ‘Android’
Mobile Ad Behavior By Gender & OS, October 2014 [CHART]
Women are more likely than men to click on mobile ads, and they also sport higher conversion rates and average purchase values.
Read MoreGlobal Mobile Video Ad Impressions By OS & Device, Q3 2014 [CHART]
iOS devices accounted for just 32.3% of global mobile ad impressions served during the third quarter on the Opera platform.
Read MoreAdvertising Cost Per App Install By Country & OS, Q3 2014 [CHART]
For app advertisers, the cost per install (CPI) is significantly higher on iOS than Android devices.
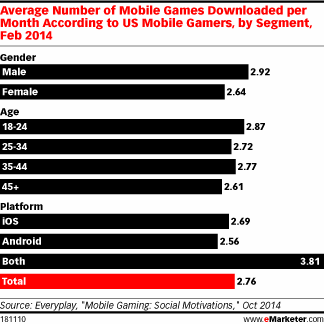
Read MoreAverage Monthly Of Mobile Game Downloads, February 2014 [CHART]
The 18-to-24 age group downloaded the most games on a monthly basis, with an average of 2.87.
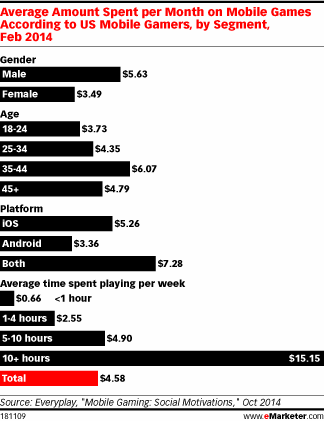
Read MoreAverage Monthly Spending On Mobile Games By Segment, February 2014 [CHART]
The smartphone gaming audience will see faster growth in 2014 and all the way through 2018.
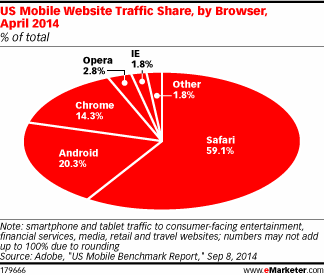
Read MoreMobile Website Traffic Share By Browser, April 2014 [CHART]
Apple devices excluding tablets accounted for 51.6% of mobile internet traffic in Q2 2014.
Read MoreAndroid Users By Device Type, 2013 vs 2014 [CHART]
iOS only recently offered a Phablet, so Flurry looked through an Android-only lens to get a clearer idea of how Phablets are faring.
Read MoreDaily App Use By US Android Smartphone Users, H1 2014 [CHART]
Some 39% of Android smartphone users’ daily application activity takes place between the hours of 5PM and midnight.
Read MoreMobile Email Use By OS, April 2014 [CHART]
One-quarter of marketers planned to increase spending on email marketing.
Read MoreMobile App Use, Q4 2011-Q4 2013 [CHART]
Adult iPhone and Android owners in the US used an average of 26.8 applications per month during Q4 2013.
Read More