Technographics
Tablet vs. Smart Phone Impressions, December 23-27, 2012 [CHART]
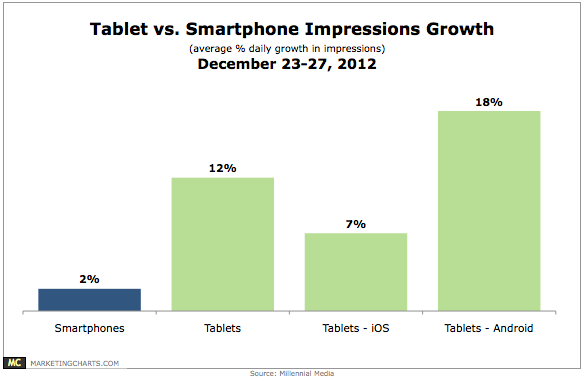
Recent research from Flurry has revealed the flood of tablet activations on Christmas Day, and new data from Millennial Media supports the idea that tablets were a preferred gift item this past holiday season.
Read MoreGlobal Consumer Electronics Ownership, October 2012 [CHART]
Smart phone penetration climbed from 48% in 2011 to 58% in 2012, while tablet ownership rates almost doubled over the same period, going from 14% to 25%.
Read MorePlanned Consumer Electronics Purchases [CHART]
The poll found that four devices topped the list of consumer electronics that respondents planned to purchase over the next 12 months—smart phones, PCs, HDTVs and tablets.
Read MoreTop iPhone Apps Of 2012 [CHART]

The iPhone apps on the list that saw the biggest year-over-year growth were Facebook Messenger (+554%) and Instagram (+197%), also owned by Facebook.
Read MoreTop Android Mobile Apps Of 2012 [CHART]
On Android, the Google Search app had the greatest number of average monthly unique users, followed by apps for Gmail, Facebook, Google Maps and YouTube.
Read MoreUS Retail mCommerce As A Percentage Of Retail eCommerce Sales By Device, 2011-2016 [CHART]
The rapid rise in mcommerce sales on tablets means that such purchases will account for 9.4% of all retail ecommerce sales this year, and 16.9% of the total by 2016.
Read MoreUS Retail mCommerce Sales By Device, 2011-2016 [CHART]
This year, US consumers will spend $24 billion shopping on their tablets, and that figure will nearly double by 2015.
Read MoreFrequency Of Mobile Social Network Visits, July 2011 & March 2012 [CHART]
In the US, 60% of smartphone users surveyed by Google in March 2012 reported that they visited mobile social networks daily, up from 54% in July 2011.
Read MoreDevices On Which People Access Social Media, 2011 & 2012 [CHART]
There is no question that social media has gone mobile, as more and more consumers access their accounts via smart phones and tablets.
Read MoreCollege Student Access To Select Media By Channel, January 2013 [CHART]
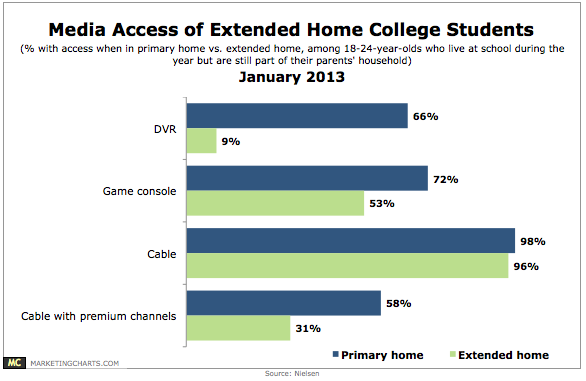
The 18-24 demographic is watching slightly less TV these days, and concurrently watching more internet and mobile video.
Read More