Online Behavior
Time Spent With Mobile Apps By App Ranking
Overall, the top 50 apps ate up 58% of US users’ app time, Nielsen determined.
Read MoreTime Spend With Mobile Apps vs Mobile Web [CHART]
According to Nielsen, US Android and iOS app users spent 101 billion minutes per month with their apps in March 2012, more than double the amount from a year earlier.
Read MoreBuilding An Engaged Audience [INFOGRAPHIC]
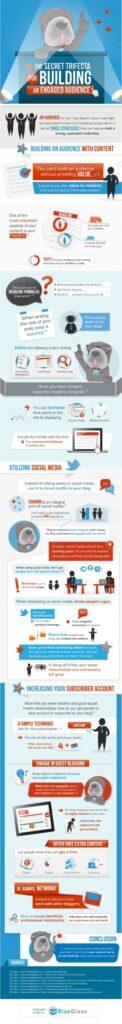
This infographic from BlueGlass is a great guide for building an audience using content marketing.
Read MoreManaging Millennials [INFOGRAPHIC]
UNC’s Kenan-Flagler Business School and the YEC researched and created this infographic so we can all know just how to manage Millennials.
Read MoreSocial Travellers [INFOGRAPHIC]
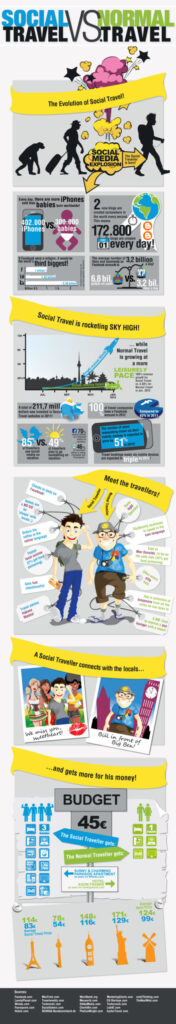
This Wimdu Travel infographic profiles the social traveller.
Read MoreSocial Media Personas [INFOGRAPHIC]
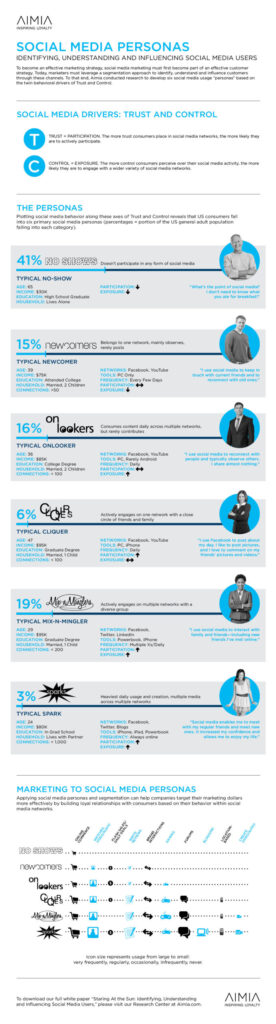
Amia research created this infographic of six different social media personas.
Read MoreEarned Social Media Purchase Influence Demographics [CHART]
18% of US consumers – including 23% under 35 – have bought a brand because their friends like or follow the brand on a social network, per findings from an Ipsos survey.
Read MoreThe Engagement & ROI Of Personalization [CHART]
Although social graph data is the type of information used by the fewest digital marketers to personalize the online experience, the vast majority who use this data report a high impact on ROI and engagement
Read MoreProfitability Of Multichannel Retail Customers [CHART]
50% of multichannel retail customers are significantly more profitable than single-channel customers.
Read MoreAmerican TV & Online Video Viewers By Device [CHART]
Despite the growing use of second- and third-screen devices, TVs remain the dominant way that people get their video fix.
Read More