Household Income
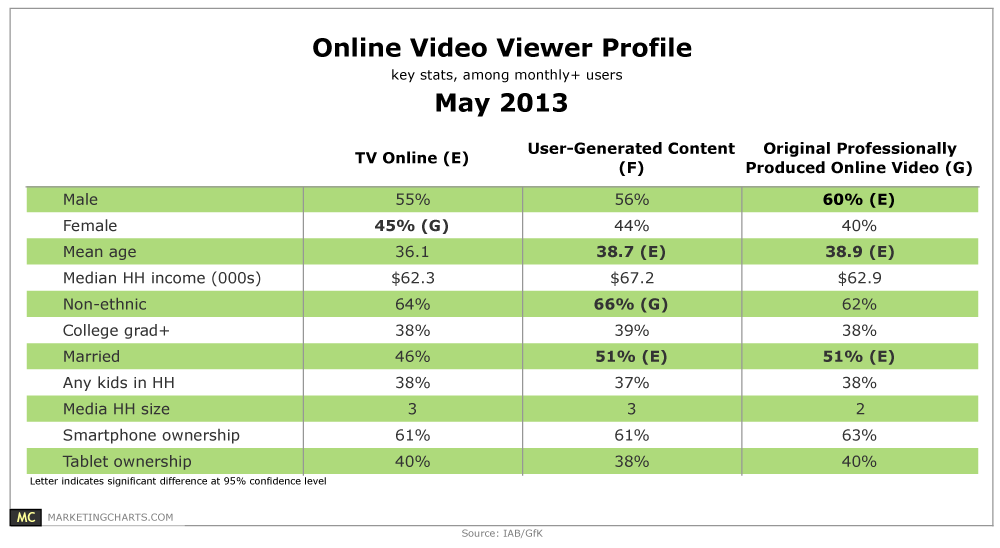
Demographics Of Online Video Viewers By Video Type, May 2013 [TABLE]
1 in 5 or more American adults watch a TV show online (23%), user-generated content (UGC – 31%), or originally produced online video (OPOV – 19%) on at least a monthly basis.
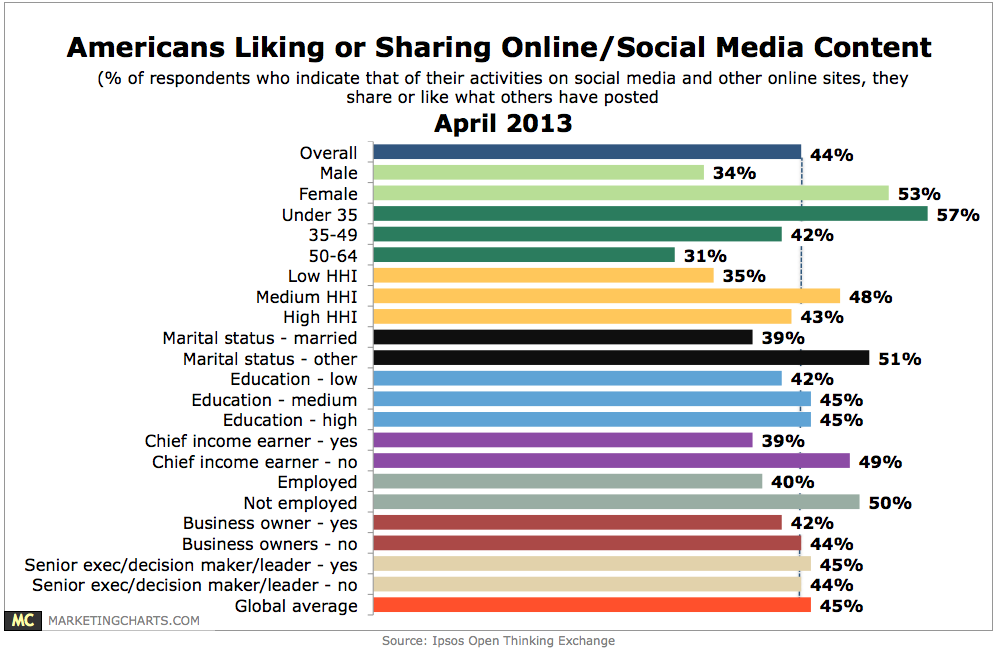
Read MoreAmericans Liking & Sharing Online Content By Demographic [CHART]
44% of Americans say they share or like online content that others have posted on social media and other online sites.
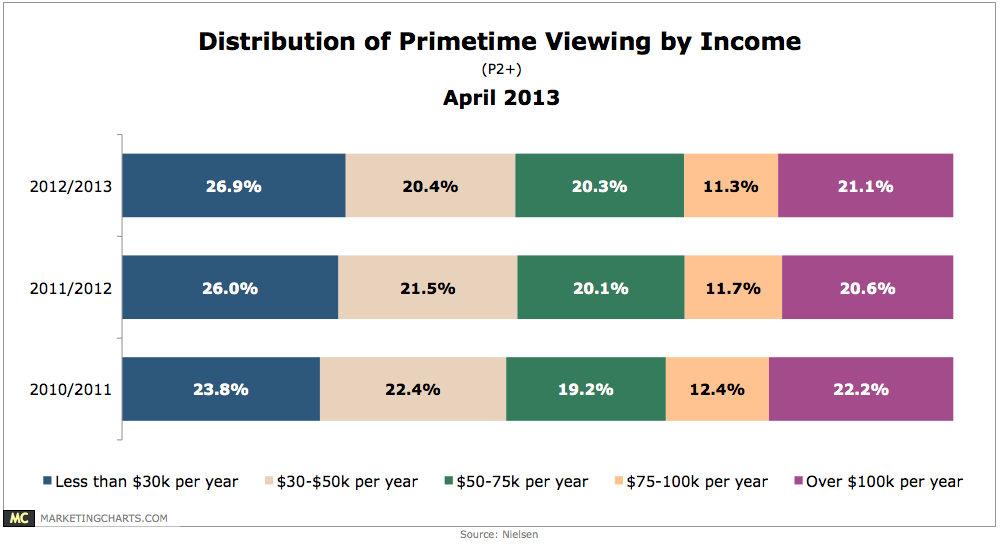
Read MorePrimetime TV Viewers By Income, April 2013 [CHART]
Although they watch less TV during the day, wealthy households (income of more than $100k per year) still make up more than one-fifth share of primetime viewing.
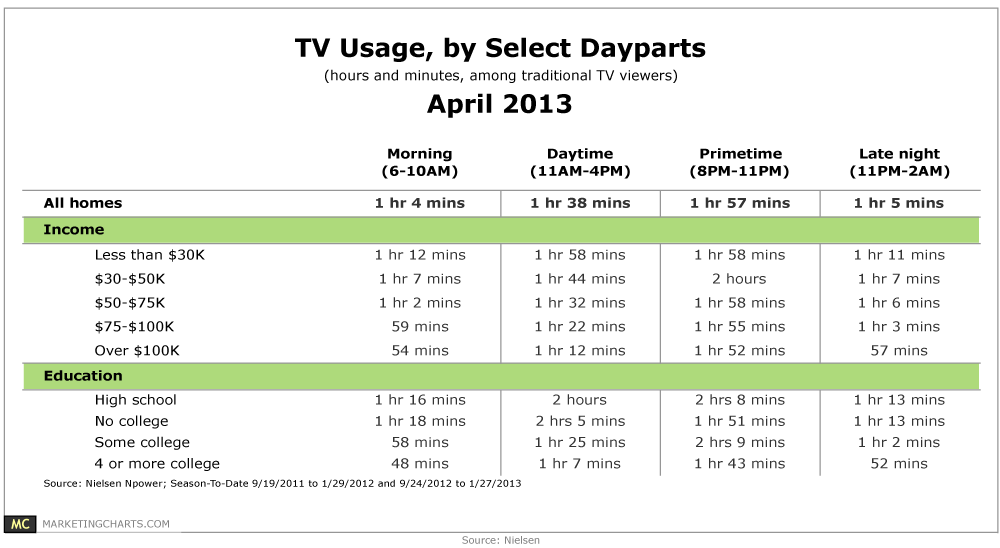
Read MoreTV Viewership By Daypart, April 2013 [TABLE]
Nielsen’s figures reveal that traditional TV viewers watch close to 2 hours of TV per day during primetime hours, but they spend more than 1-and-a-half hours watching during the daytime hours of 11 AM-3 PM, too.
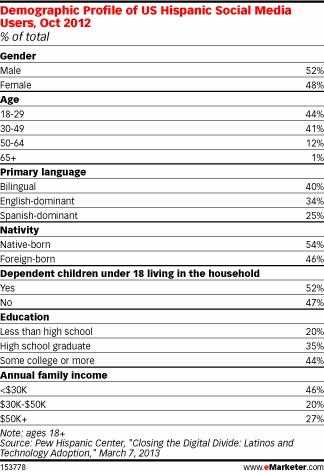
Read MoreDemographics Of US Hispanic Social Media Users, October 2012 [TABLE]
Latino social networking penetration among internet users reached 68% last year.
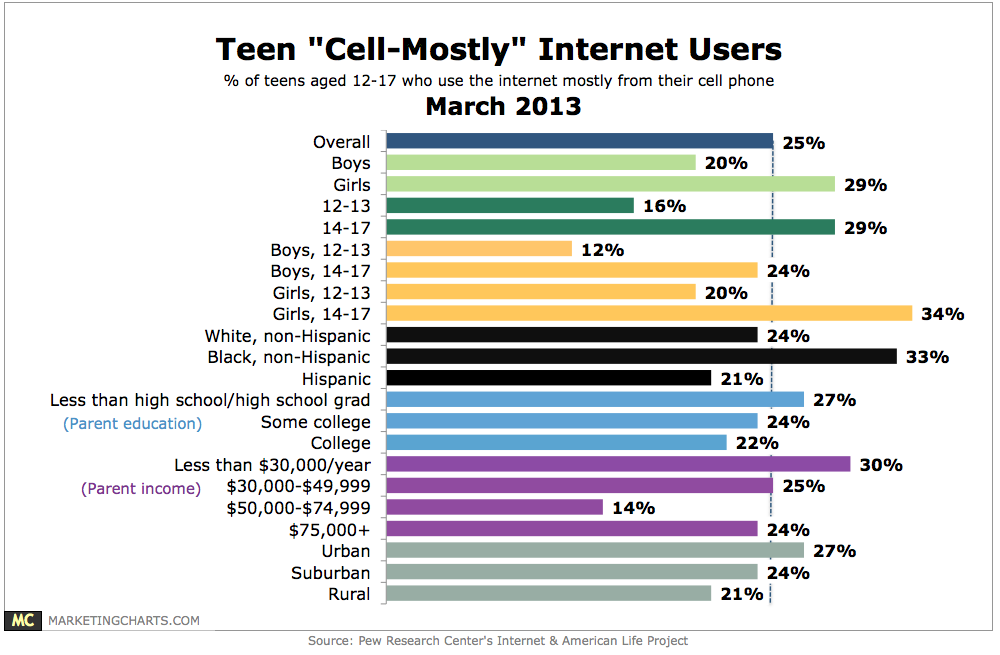
Read MoreMostly Mobile Online Teens, March 2013 [CHART]
78% of American teens (aged 12-17) now own a cell phone, and 47% of those teens own a smart phone.
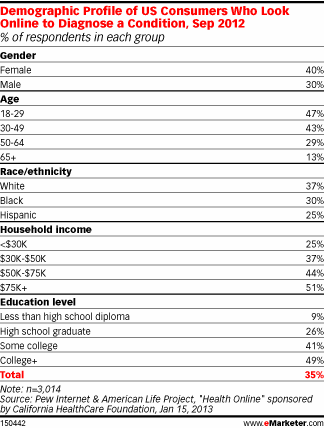
Read MoreDemographics Of Online Health Care Diagnosis Seekers, September 2012 [TABLE]
40% of women and 30% of American men relied on the Internet to diagnose medical conditions.
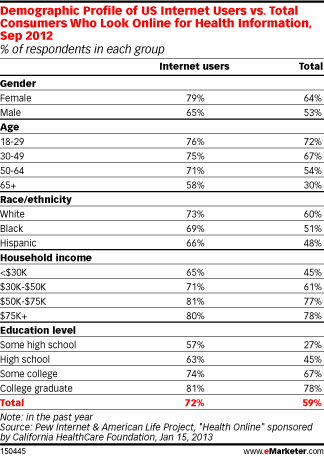
Read MoreOnline Health Seeker Demographics, September 2012 [TABLE]
72% of US internet users and 59% of the general population had looked online for health information within the past year.
Read MoreFacebook User Demographics [TABLE]
Facebook remains the most-used social networking platform, as two-thirds of online adults say that they are Facebook users.
Read MoreTumblr User Demographics [TABLE]
Just 6% of online Americans use Tumblr.
Read More