Online Behavior
Social Media Use Frequency By Channel [CHART]
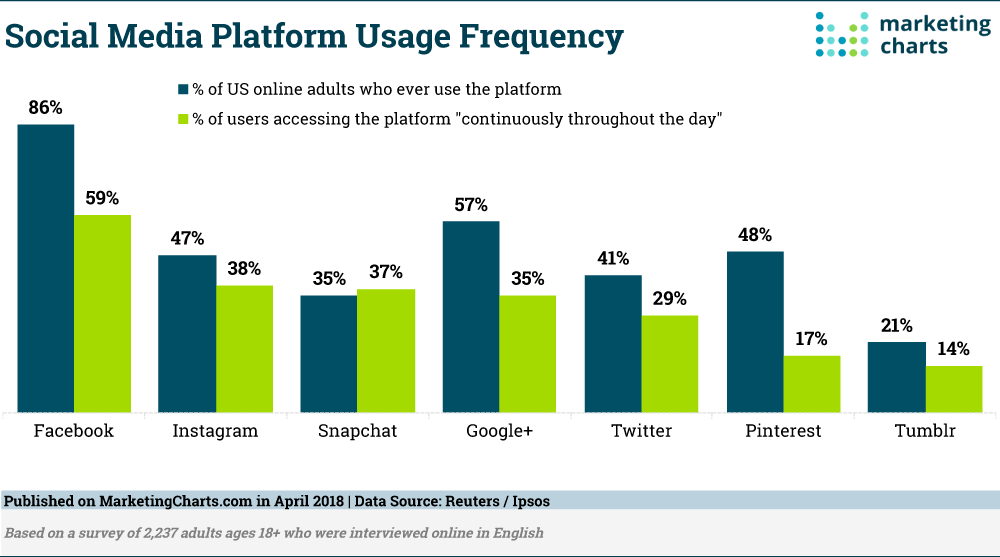
About 7 in 10 American adults report being online ‘almost constantly’ (26%) or ‘several times a day’ (43%), according to recent data from the Pew Research Center. Many of those are likely spending their online time visiting social media platforms.
Read MoreCross-Device Shopping Journey Changes [CHART]
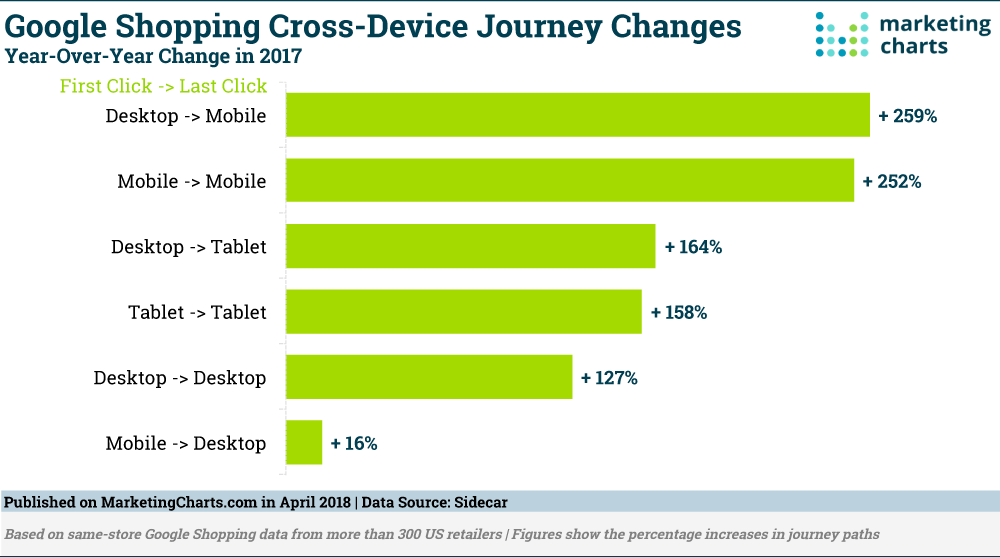
US retailers are prioritizing Google Shopping ads over text ads, according to the 2018 Google Shopping Benchmarks Report from Sidecar. Based on an analysis of more than 300 US retailers’ activity in 2017, the report notes that ad spending across Google’s search network grew by 20%, with much greater increases for Google Shopping ads (34%) than for text ads (2%).
Read MoreRecent Podcast Listeners By Device [CHART]
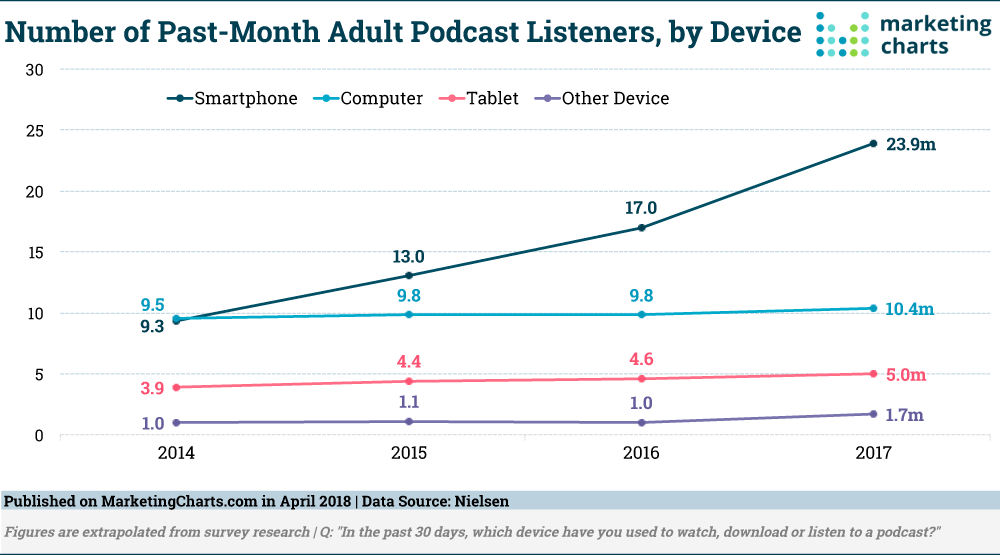
Podcast awareness and popularity are both on the rise, with a recent study suggesting that 64% of respondents ages 12 and older are familiar with the term ‘podcasting,’ up from 49% three years ago.
Read MorePodcast Listeners By Location [INFOGRAPHIC]
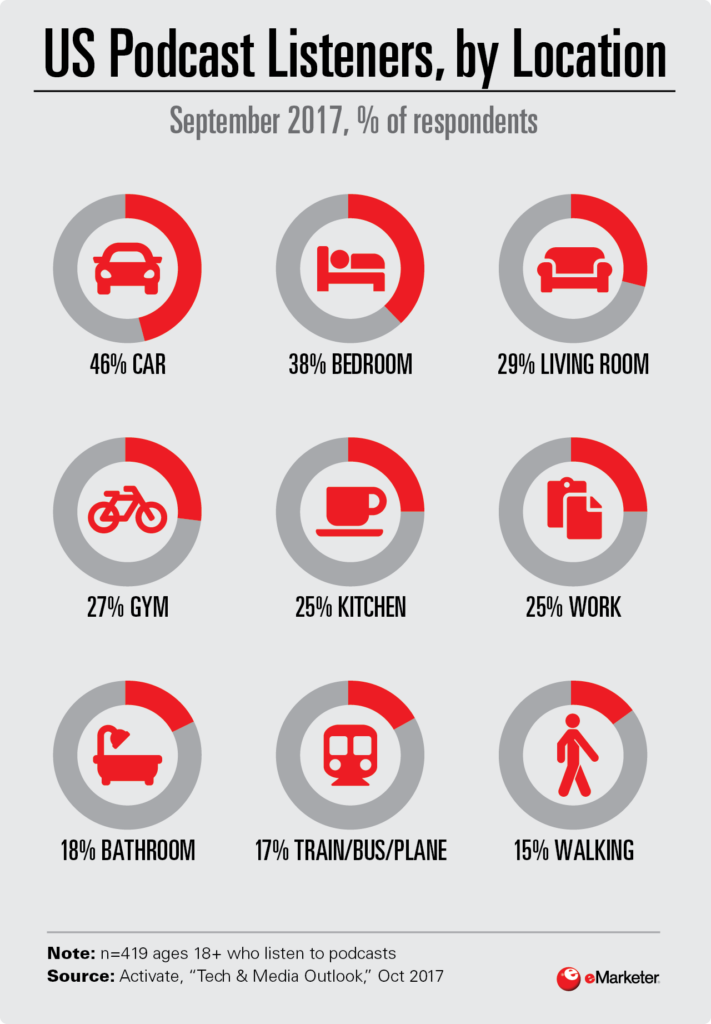
This infograpic by eMarketer breaks down where people listen to podcasts.
Read MoreSocial Retail By Age & Plaform [TABLE]
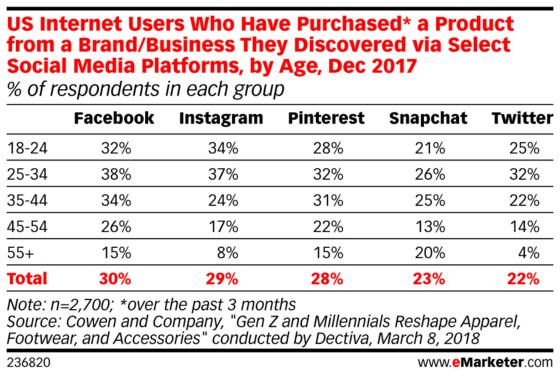
Millennials had higher incidences of being inspired by Instagram to make a purchase, though buying spurred by Snapchat was more evenly distributed by age.
Read MoreReasons Facebook Users Are Sharing Less [CHART]
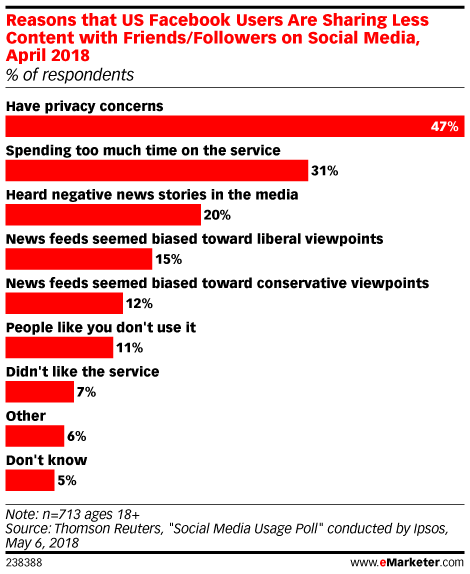
For the most part, Facebook users haven’t stopped using the social platform following the Cambridge Analytica revelations. In fact, in its Q1 2018 earnings report, the social media giant showed no sign of users—or advertisers—abandoning its platform.
Read MoreUS Proximity Payment Users By Platform [CHART]
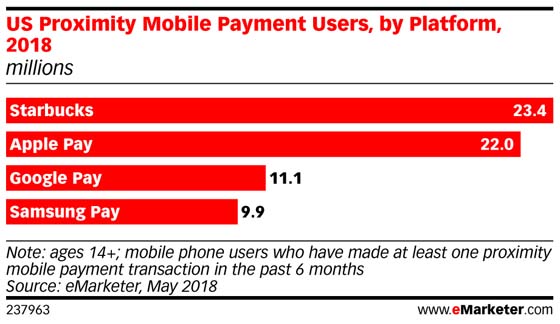
Starbucks will remain the most popular proximity mobile payment app, staying ahead of Apple Pay and other competitors. This year, 23.4 million people ages 14 and over will use the Starbucks app to make a point-of-sale purchase at least once every six months.
Read MoreTop Podcast Publishers [INFOGRAPHIC]
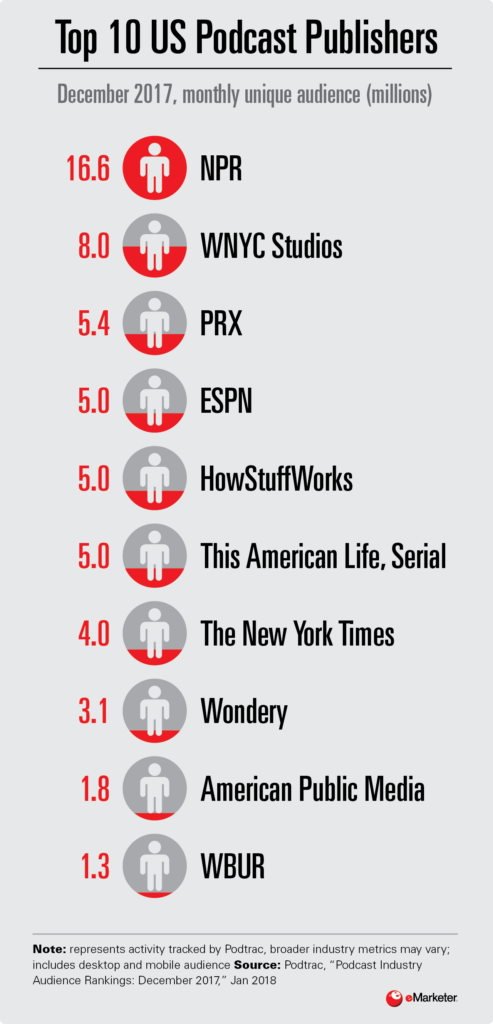
This infograpic by eMarketer breaks down the top podcast publishers, with National Public Radio and WNYC leading the list.
Read MoreTop Video Streaming Service Benefits [CHART]
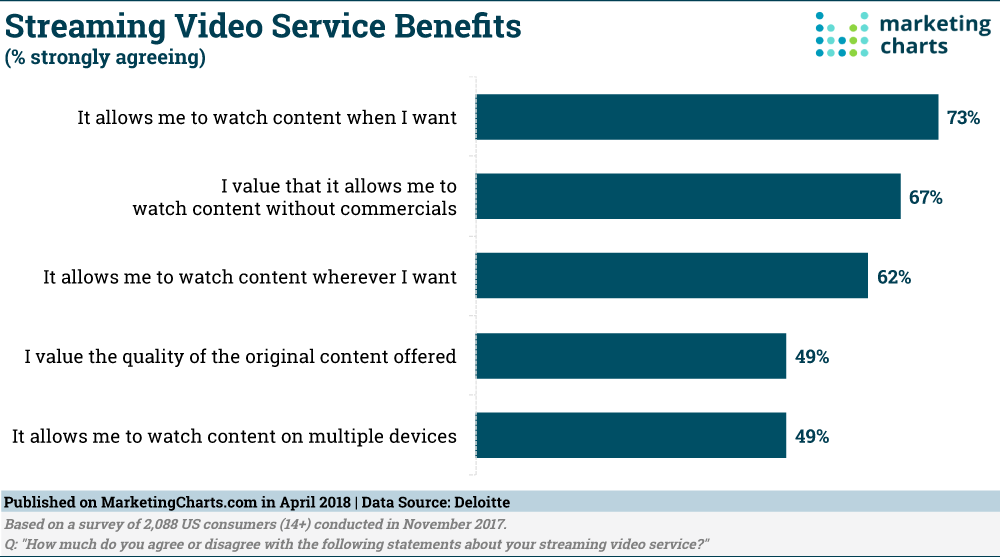
More than half (54%) of streaming video subscribers surveyed last year said they had signed up for a service to watch original content.
Read MoreTime Spent With eTailers [CHART]
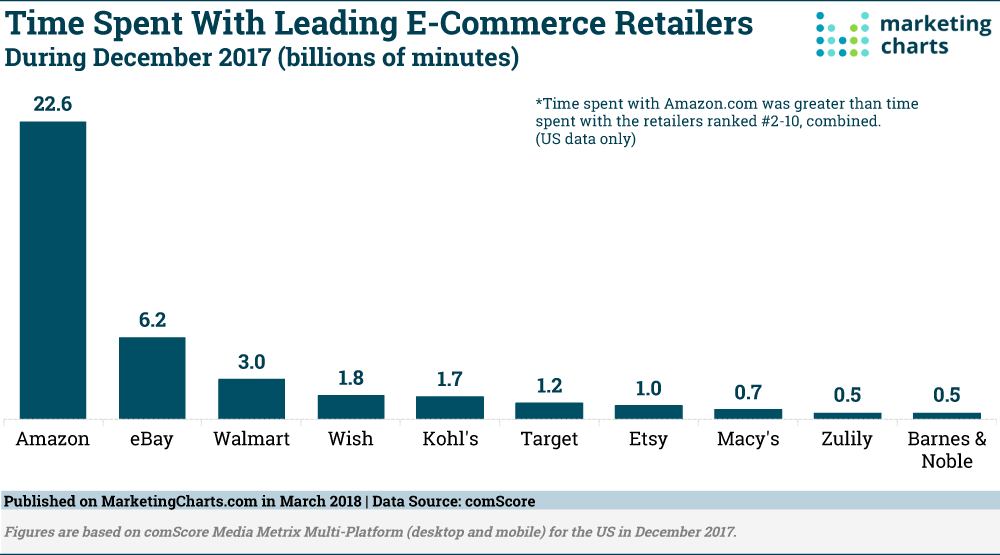
Americans spent 22.6 billion minutes on Amazon during December 2017, more than the combined total spent on the rest of the top 10 e-commerce retailers (16.6 billion).
Read More