Consumer Attitudes
Online Americans Who Have Bought A Product Because Proceeds Went To A Cause, October 2012 [CHART]
A majority of US internet users have been moved to purchase because of a cause.
Read MoreConsumer Attitudes Toward Advertising Creative & Product Recall, January 2013 [CHART]
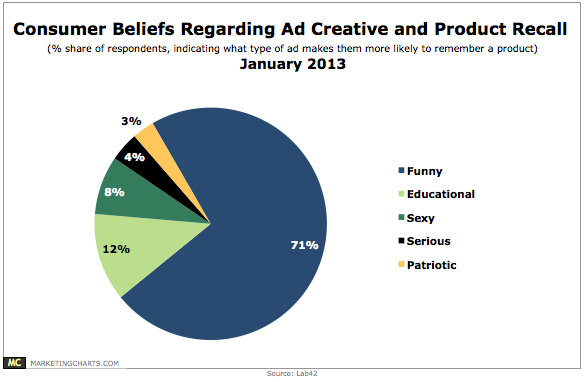
The most-liked TV ads in 2012 relied on audience-appropriate humor, an ownable creative concept and a relatable, emotional appeal.
Read MoreConsumer Trust In Advertising, January 2013 [CHART]
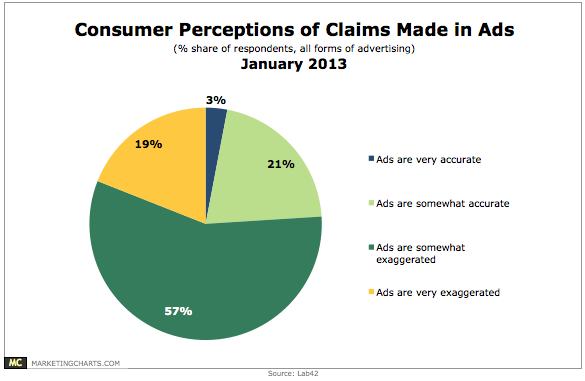
Just 3% of Americans believe that claims made in ads are very accurate, with far more (19%) believing them to be very exaggerated.
Read MoreAmericans' Hopes For 2013 By Demographics [CHART]
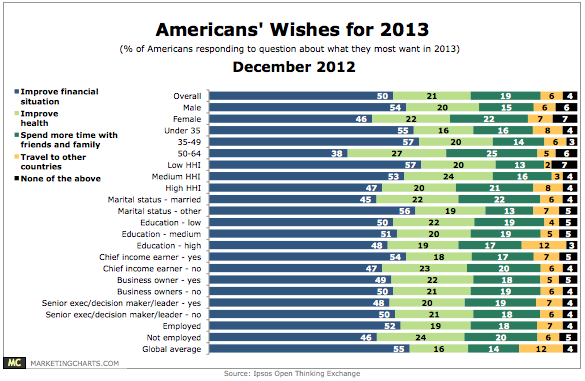
Half of Americans said they would like to improve their financial situation in 2013.
Read MoreThe Millennial Mind [INFOGRAPHIC]
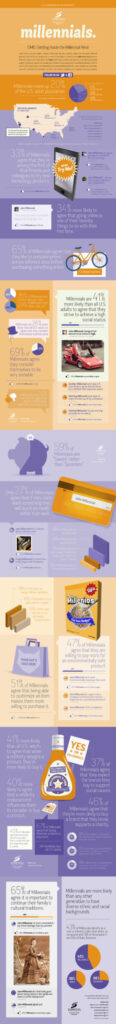
This Scarborough infographic uncovers the attitudes that motivate the purchasing decisions and lifestyle behaviors of Millennials.
Read MoreEngagement With Local Stories [PRESENTATION]
When you come across a story about your town, city or state, what makes you want to share it?
Read MoreAppreciation [INFOGRAPHIC]
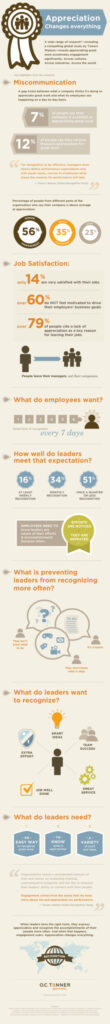
This infographic from O.C. Tanner illustrates appreciation on the job.
Read MoreMost Socially-Engaging TV Genres, January-November 2012 [CHART]

Sports (31%) and reality (17%) are the primary genres generating social TV buzz, combining to account for about half of social TV conversations.
Read MoreAnticipated Smart TV Market Growth, January 2013 [TABLE]
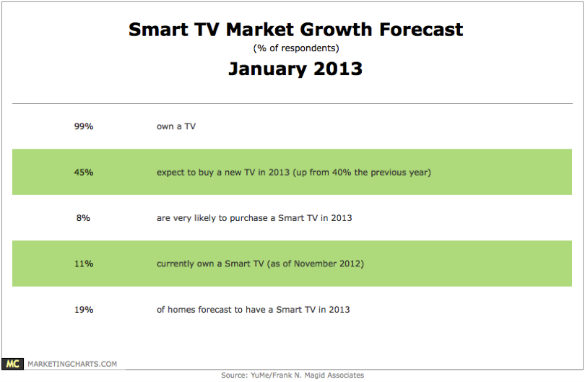
19% of homes will have a Smart TV this year.
Read MoreeBook vs Printed Book Readership, December 2011 vs November 2012 [CHART]
The proportion of Americans aged 16 or older who claim to have read a printed book in the past 12 months has dropped to 67% from 72% a year earlier.
Read More