Advertising
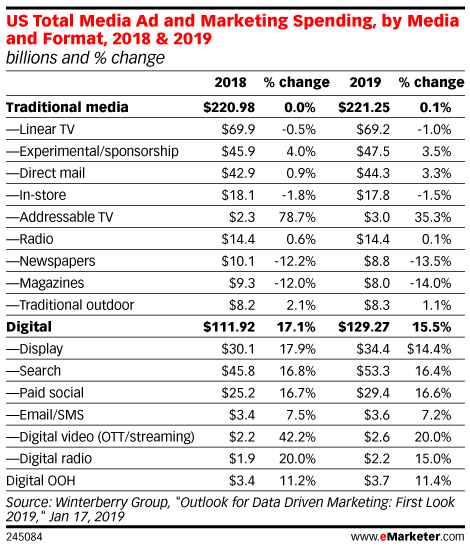
Ad Spending By Media & Format, 2018-2019 [TABLE]
Ad spend on over-the-top (OTT) streaming video will increase 20% this year to $2.6 billion, according to a Winterberry Group study of US ad spend data.
Read MoreMobile Advertising [INFOGRAPHIC]
This infographic from Connext Digital illustrates some statistics and trends about mobile advertising.
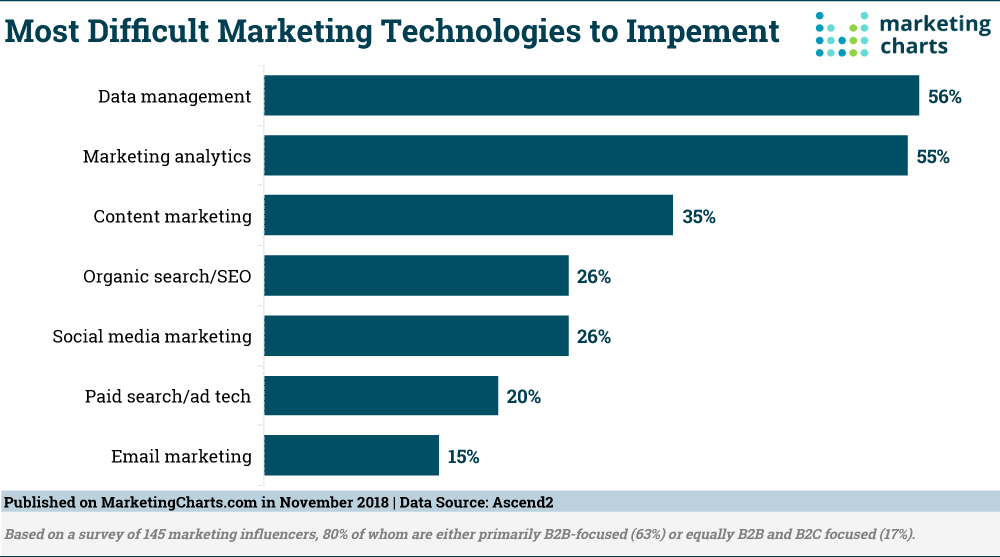
Read MoreMost Difficult Marketing Technology To Implement [CHART]
Most marketers today are working on implementing necessary marketing technologies at their organization, according to an Ascend2 report, which finds that their martech strategies revolve primarily around increasing ROI and improving marketing efficiency.
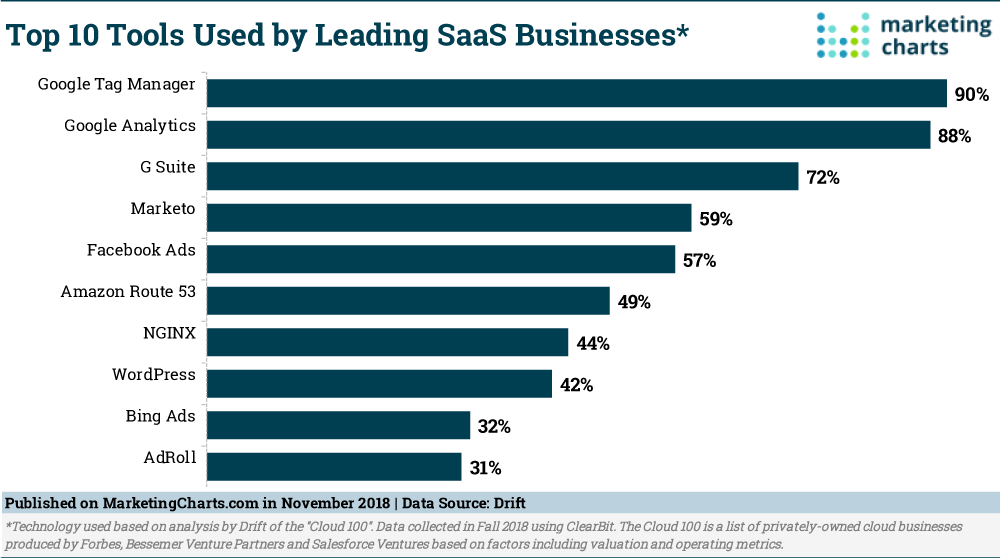
Read MoreMost Popular SaaS Tools [CHART]
Beating out the likes of Facebook, Amazon and Microsoft, Google tools are more prevalent in large, high-performing SaaS businesses.
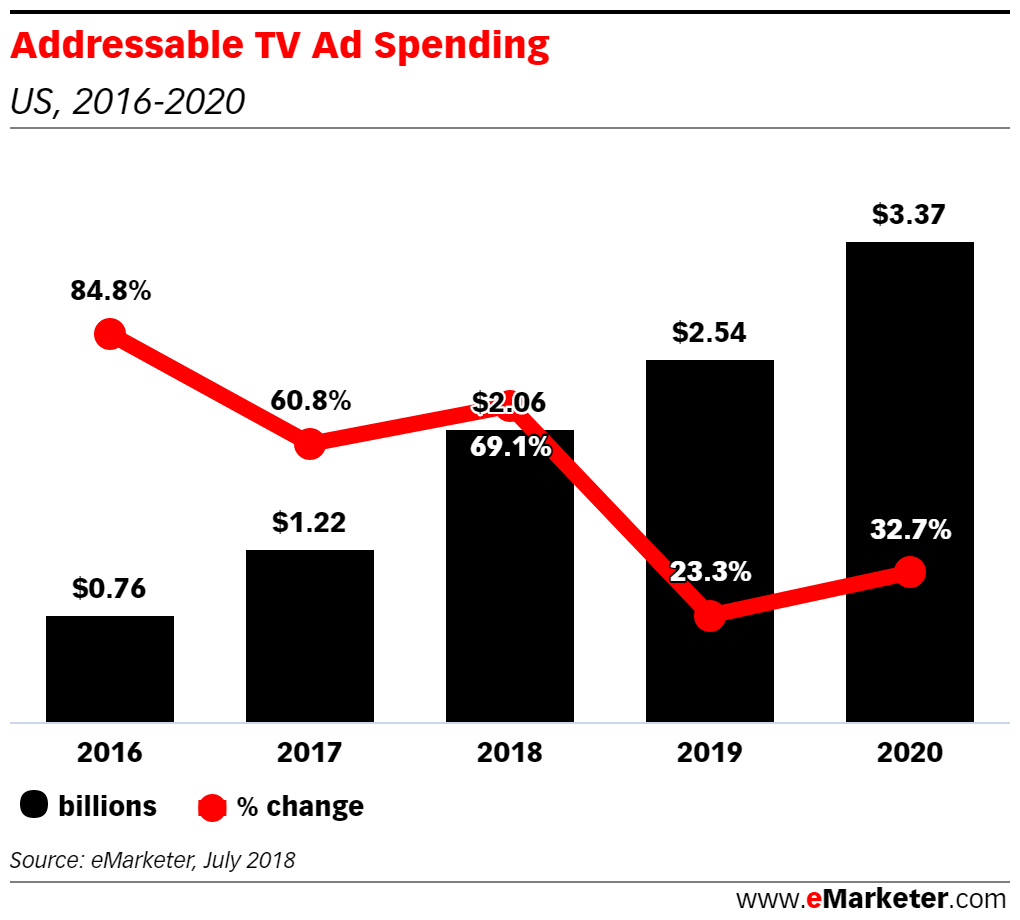
Read MoreAddressable TV Spending, 2016-2020 [CHART]
eMarketer predicts that $2.54 billion will be spent on targeted, addressable TV ads in the US this year. But addressable accounts for just 3.7% of total TV ad spending.
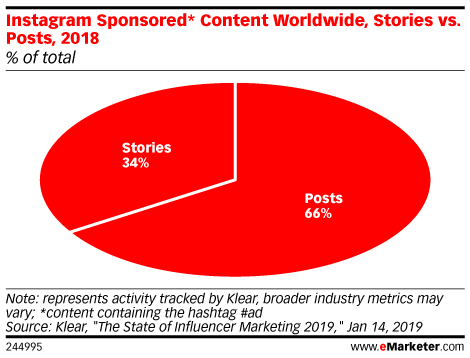
Read MoreInstagram Sponsored Stories vs Posts [CHART]
Instagram Stories is increasingly popular with social media marketers. Last year, one in three Instagram posts containing “#ad” was a story, according to a study by Klear.
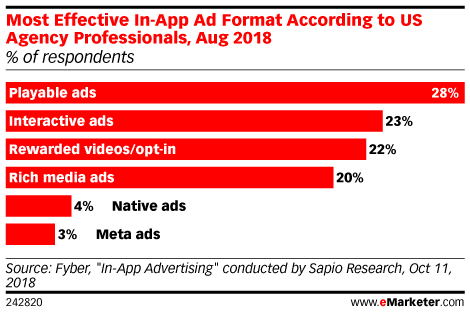
Read MorePlayable Ads Lead In-App Formats [CHART]
Playable ads do just that by allowing users to actively engage with a branded experience or demo a gaming app before downloading it instead of passively watching a video.
Read MoreVideo Marketing Statistics [INFOGRAPHIC]
This infographic from Renderforest illustrates 47 video marketing statistics to help you think through your video marketing strategy.
Read MoreGoogle Ads Timeline [INFOGRAPHIC]
This infographic from Edge45 illustrates Google Ads complete timeline, from its launch as Google AdWords in 2000 to its 2018 rebrand as Google Ads.
Read More