Posts by derickson
US Mobile Search Ad Spending, 2011-2017 [CHART]

Desktop search volume declined for the first time, while the share of queries from smart phones and tablets reached roughly 20%.
Read MoreHow People Binge On TV, February 2013 [CHART]

Most US TV viewers (63%) had used an online subscription service (like Netflix) to binge-view TV.
Read MoreBinge TV Viewing Behavior By Demographic, February 2013 [TABLE]
62% of people watched multiple episodes of a TV show in succession, also known as “binge-viewing.”
Read MoreHow People Watch Time-Shifted TV By Demographic, February 2013 [TABLE]
Nearly eight out of 10 US adult internet users watched TV on their own schedule.
Read MoreUS Online Ad Revenues, 2003-2012 [CHART]
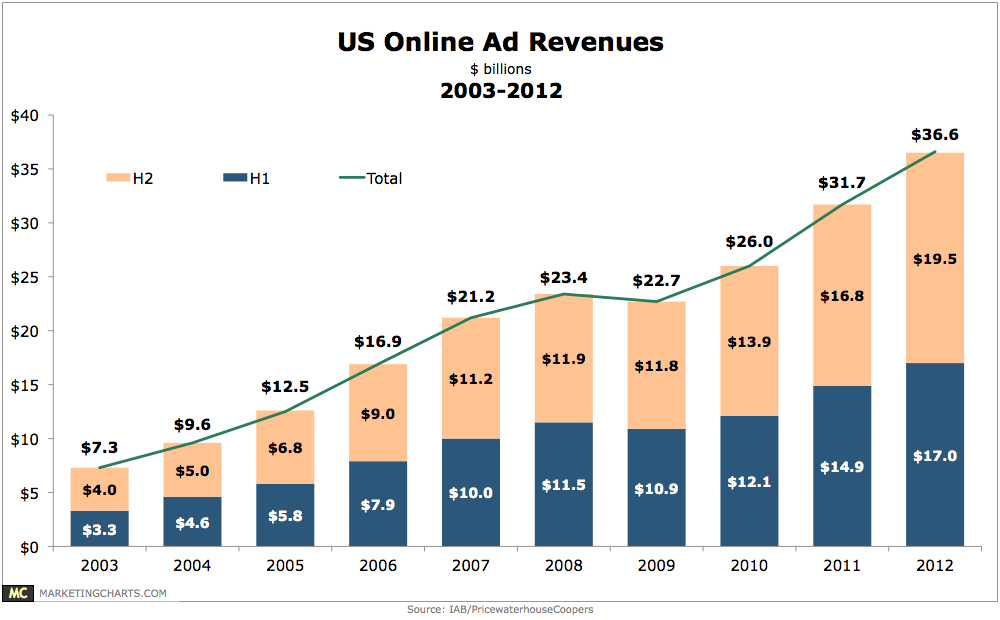
Online ad spend has reached a new peak, hitting $10.31 billion in Q4, up 14.9% year-over-year.
Read MoreEffect Of Streaming Video On Traditional TV Consumption, 2006-2012 [CHART]
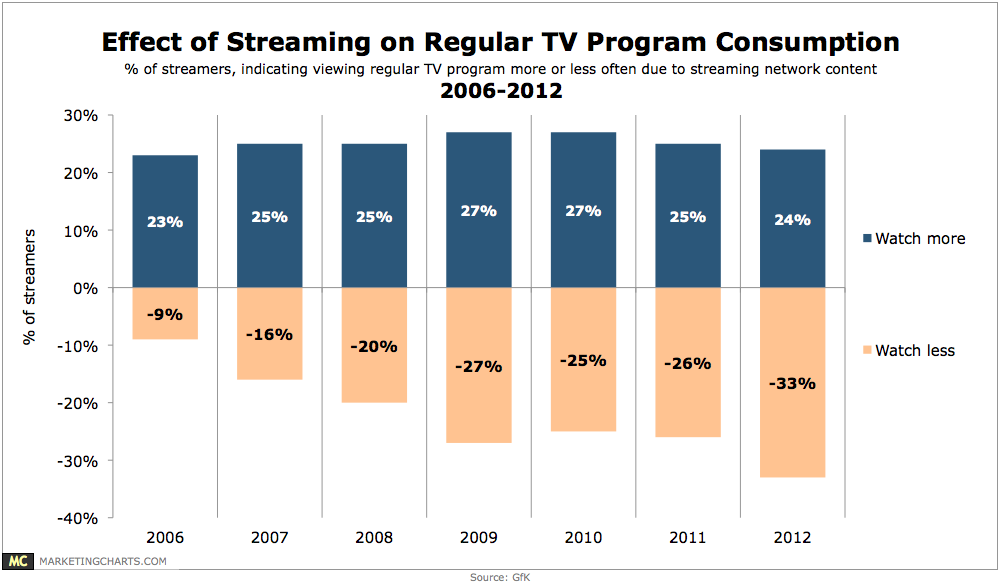
34% of US internet users (and 30% of all consumers aged 13-54) surveyed in December 2012 reported having watched streaming video content that originated from a network since the beginning of September.
Read MoreShare Of Americans' Time Online By Category, 2011 vs 2012 [CHART]
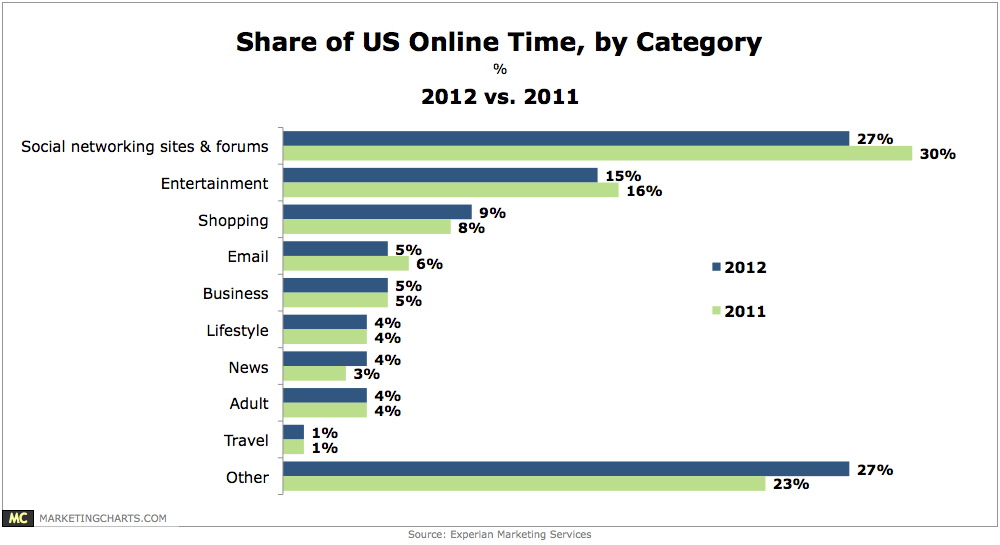
27% of Americans’ time spent online last year was spent accessing social networking sites and forums.
Read MoreOnline Ad Price Trends By Ad Type, January vs March 2013 [CHART]
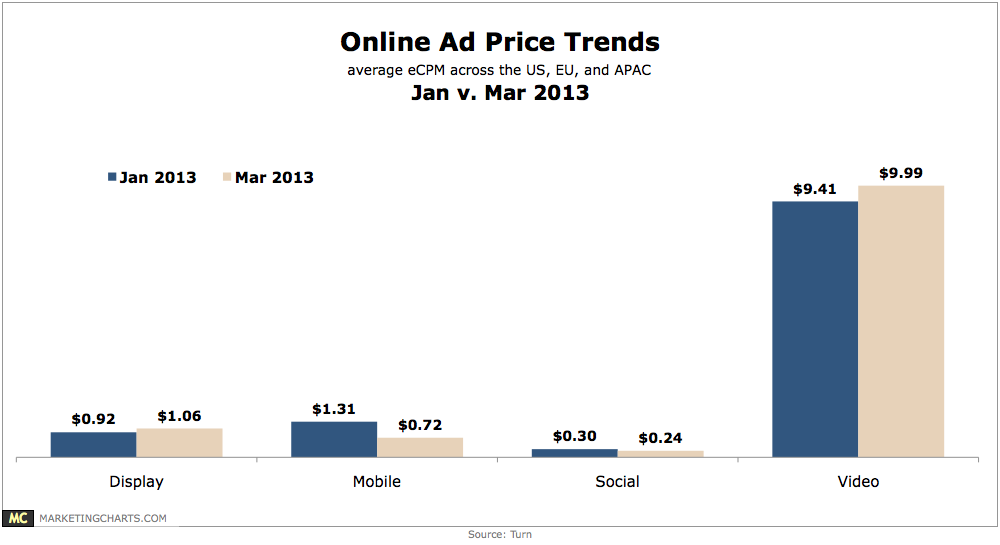
Average video eCPMs increased 6.2% between January and March 2013, from $9.41 to $9.99, while display ad prices grew by 15.2% from $0.92 to $1.06.
Read MoreRetail mCommerce Revenues, 2012 vs 2013 [CHART]
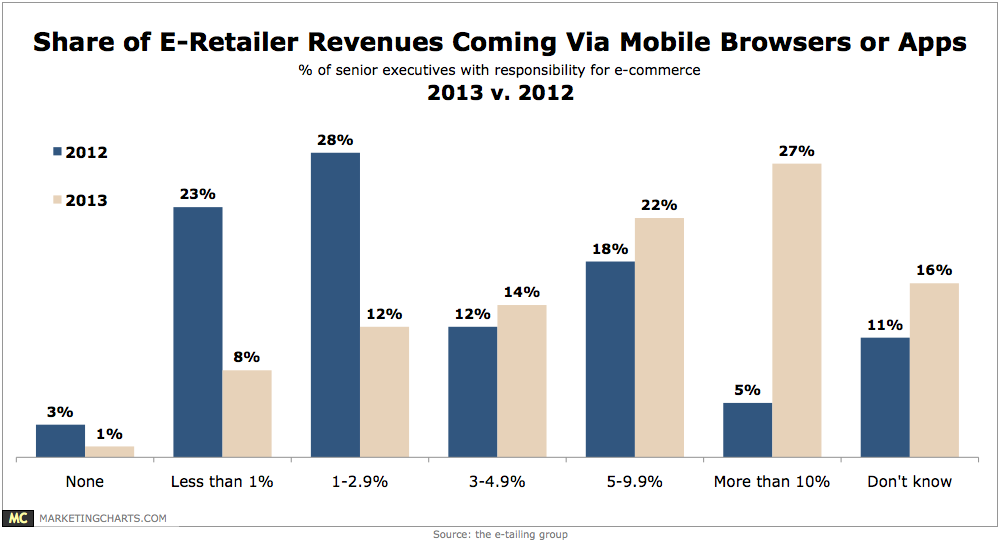
29% of eCommerce executives say that more than 20% of their traffic comes via mobile browsers or mobile applications, a marked increase from just 3% who reported that level of traffic last year.
Read MoreCPG Mobile Advertising Post-Click Actions, 2012 [CHART]
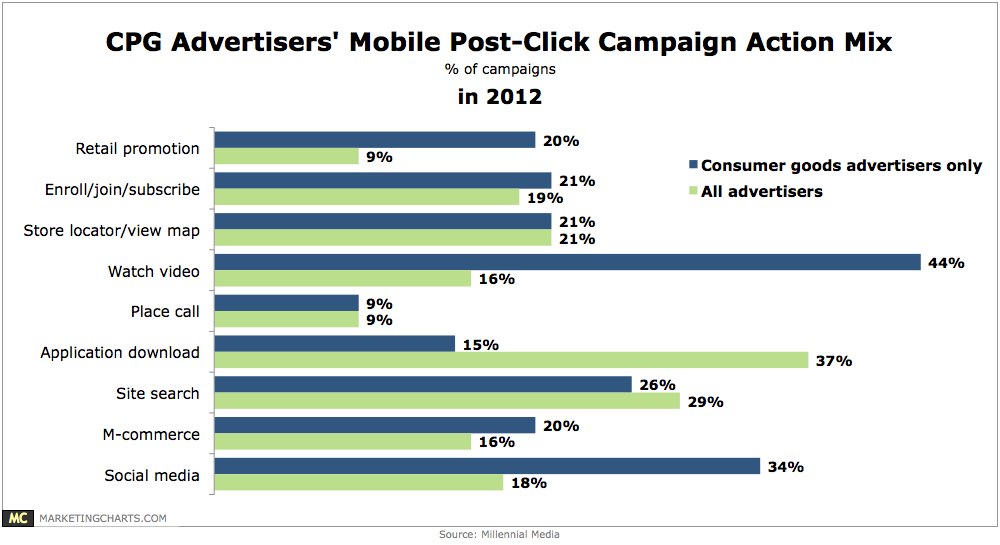
CPG brands were more focused on encouraging consumers to watch video, with 44% of the campaigns incorporating a video aspect (compared to 16% on average).
Read More