Posts by derickson
Time Spent On Mobile Device Online By Activity, Q1 2013 [TABLE]
US mobile internet users spent the greatest percentage of their mobile web time using email, a 23% share of time spent vs. only 5% of time spent on desktop.
Read MoreDevices Used To Go Online, July 2011-January 2013 [CHART]

On average, 43.5% of participants accessed the internet via a mobile phone each week during the period ending in January 2013, an 8-percentage-point increase over the period ending in July 2012.
Read MoreComparative Estimates Of US eCommerce Sales, 2012-2017 [TABLE]
Despite the positive outlook, only 6% of US retail sales came from ecommerce in 2012, according to eMarketer calculations.
Read MoreAmerican Retail eCommerce Sales CAGR By Category, 2012-2017 [CHART]

A mix of larger and smaller online product categories will post the highest CAGRs from 2012 to 2017.
Read MoreAmerican Retail eCommerce Sales By Product Category, 2011-2016 [TABLE]
Computer and consumer electronics, as well as apparel and accessories, account for the bulk of US retail eCommerce sales.
Read MoreAmerican eCommerce Sales, 2011-2017 [CHART]
In 2013, eMarketer estimates US retail ecommerce sales will total $259 billion, a 14.8% annual increase over 2012’s $225.5 billion.
Read MoreAmerican Mobile Buyers By Device, 2011-2017 [TABLE]
In 2013, 79.4 million US consumers, amounting to 51% of digital buyers, will purchase online using a mobile device.
Read MoreMillennials & Data Sharing, April 2013 [CHART]
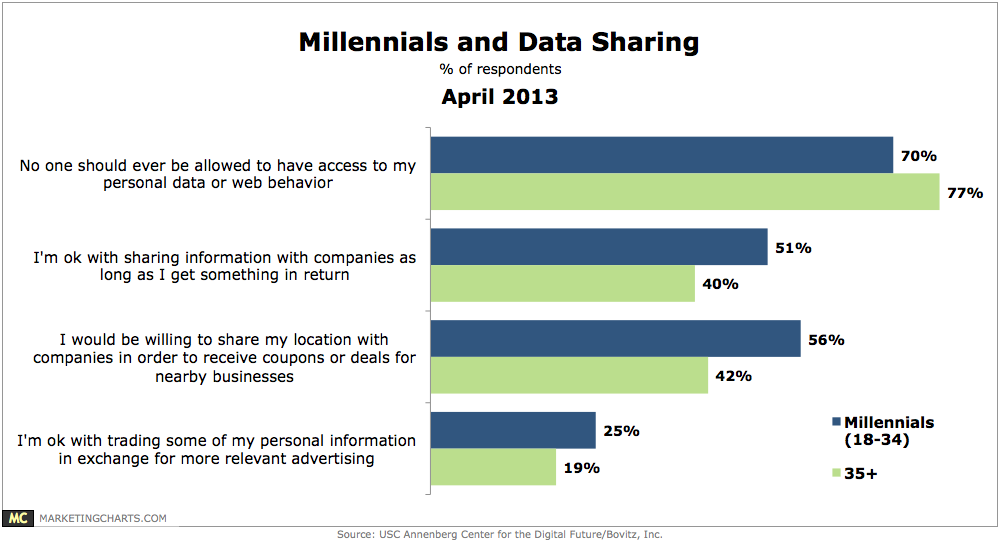
Millennials (18-34) are getting somewhat comfortable with the idea of personal data sharing, at least when it comes with tangible benefits.
Read MoreTime Spent On Multitainment Activity, April 2013 [TABLE]
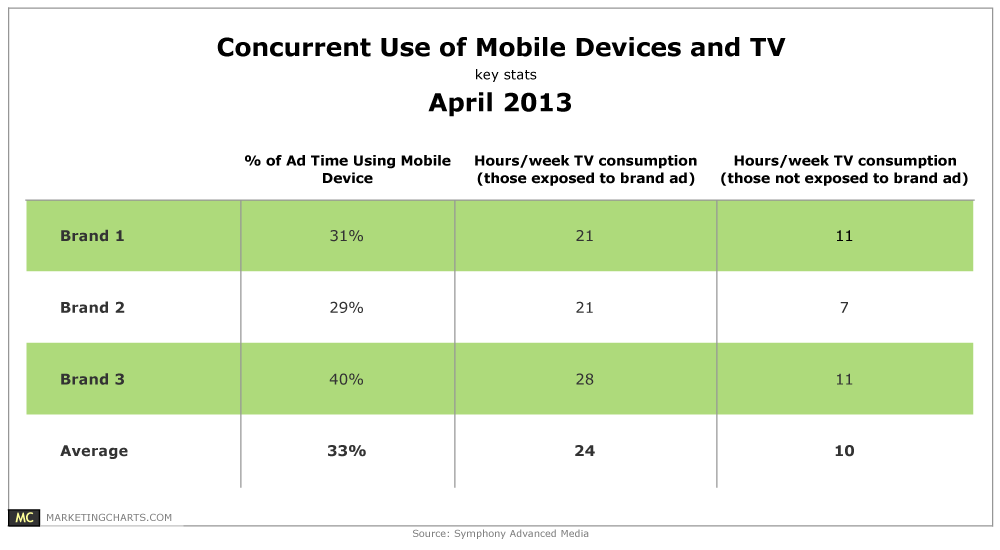
30-40% of actual TV ad viewing occurred concurrently with mobile device usage.
Read MoreAmericans Liking & Sharing Online Content By Demographic [CHART]
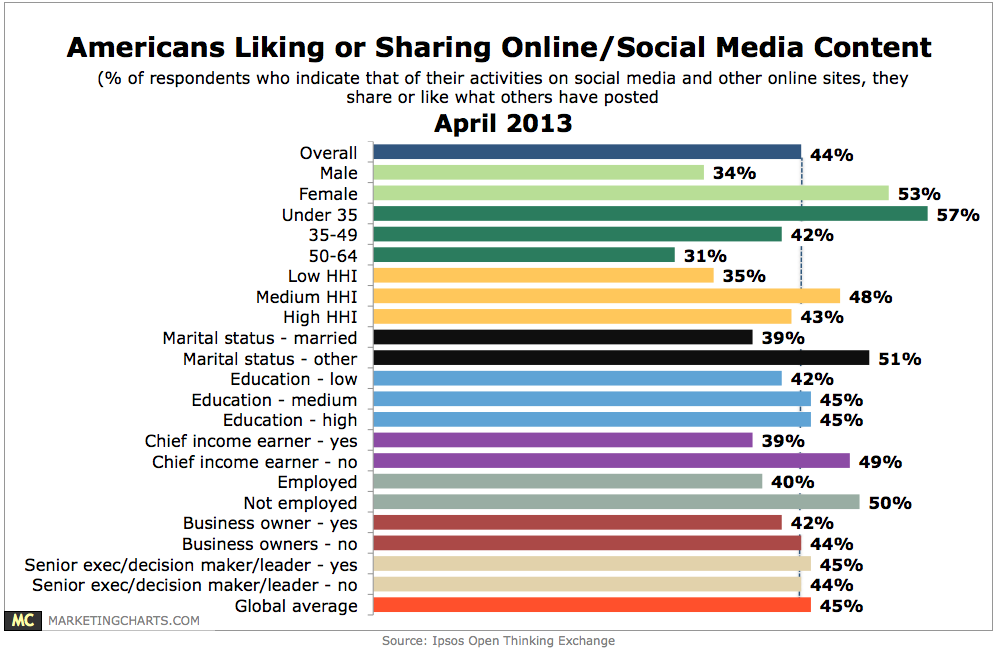
44% of Americans say they share or like online content that others have posted on social media and other online sites.
Read More