Posts by derickson
How People Find Websites, 2011 vs. 2012 [CHART]
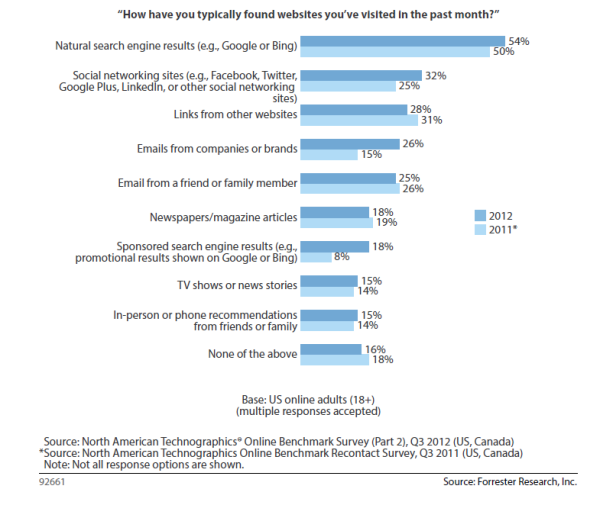
54% of respondents found websites through natural search results in 2012, up from 50% in 2011.
Read MoreFirst Person Point Of View Home Movies: Disneyland Through Google Glass [VIDEO]
Joe’s Daily compiled video clips taken via Google Glass during a vacation to Disneyland in California: One aspect of Glass that will have mass consumer appeal.
Read MoreWhy People Watch A Particular Television Show, June 2013 [CHART]
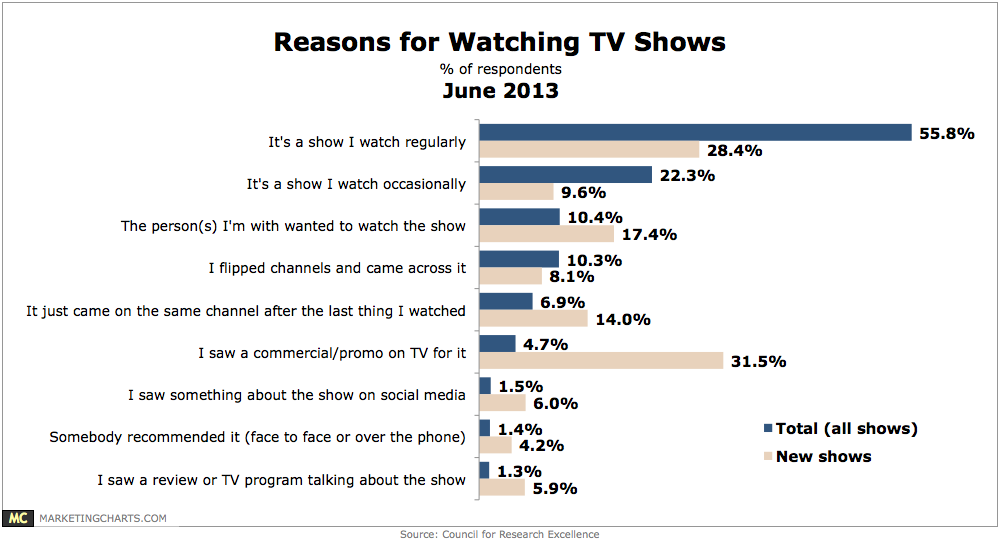
The proportion of study respondents who interact with TV-related content on social media on at least a weekly basis is triple those who do so on a daily basis (37% vs. 12%).
Read MoreThe History Of Public Relations [INFOGRAPHIC]
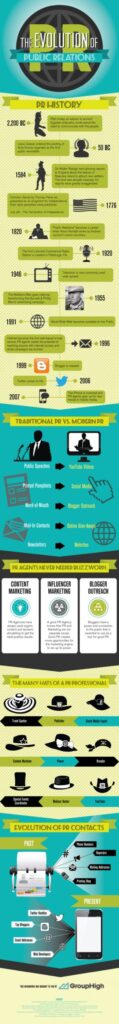
This infographic about the history of public relations was created by GroupHigh.
Read MoreAmerican Tablet Adoption Rates By Demographic, May 2013 [CHART]
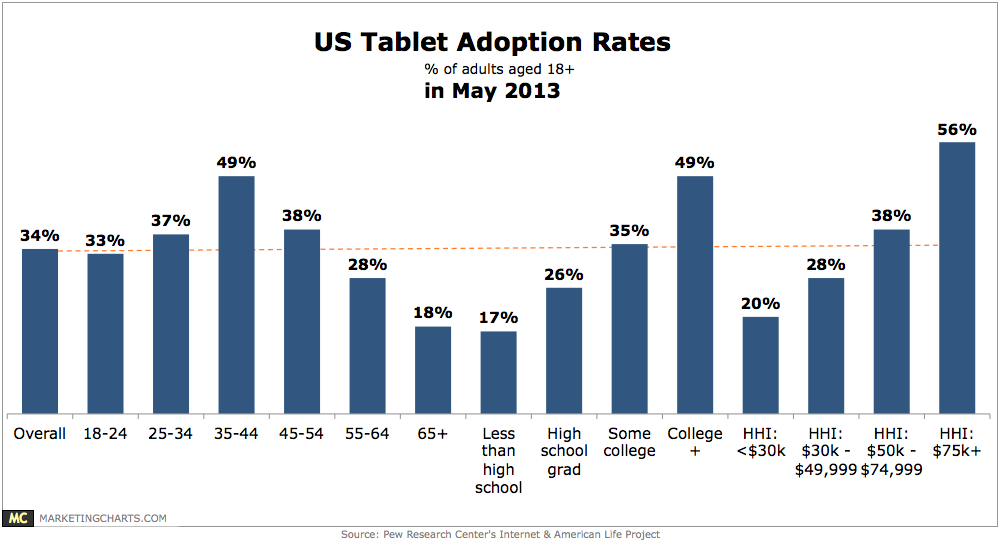
Pew’s Internet & American Life Project found 34% of American adults reporting ownership of a tablet, almost double the 18% adoption rate it found in a survey fielded in April 2012.
Read MoreFacebook Ad Performance By Industry, Q1 2013 [CHART]
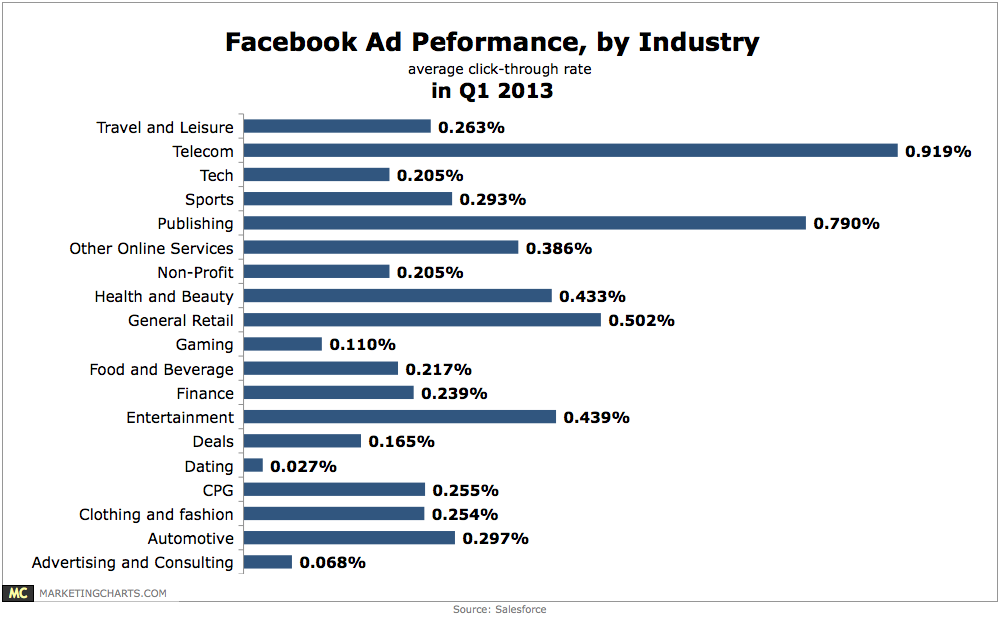
Telecom (0.919%) and publishing (0.79%) brands are leading the charge in click-through rates.
Read MoreFather’s Day Spending, 2007-2013 [CHART]
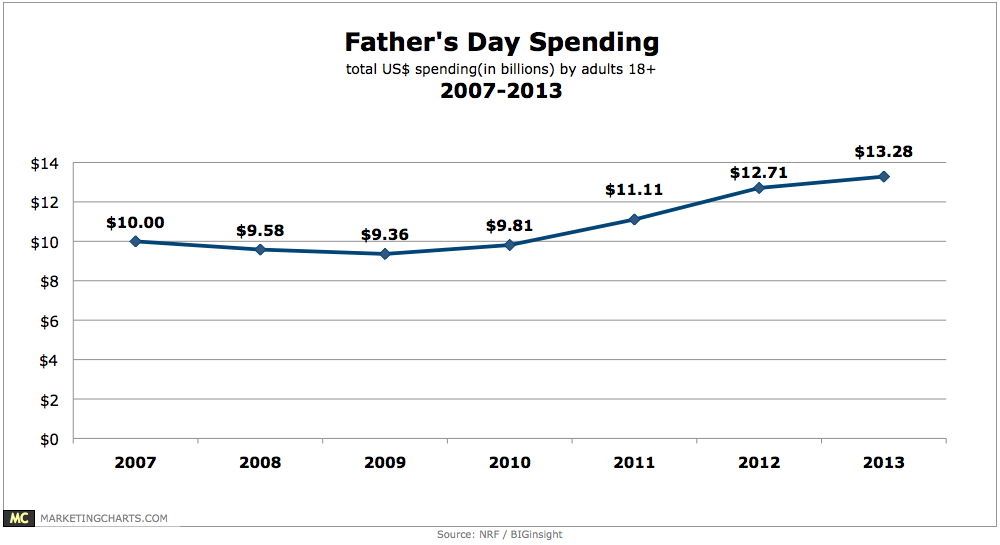
Total US spending related to Father’s Day (Sunday, June 16, 2013) should reach almost $13.3 billion in 2013.
Read MoreDemographics Of Social Media Users By Network, October 2012 [TABLE]
Mobile will be the dominant platform to reach US millennials for the foreseeable future.
Read MoreDemographics Of Auto Website Visitors, June 2012 [CHART]
The 18-to-34-year-old segment still makes up a large portion of digital automotive media consumption.
Read MoreAmerican New-Vehicle Registrations By Generation, 2001-2012 [CHART]
In 2001, 18- to 34-year-olds registered 24% of all new vehicles in the US; by 2012, that figure had dropped to 13%.
Read More