Posts by derickson
US Online Ad Spending Share By Objective, 2013-2017 [CHART]
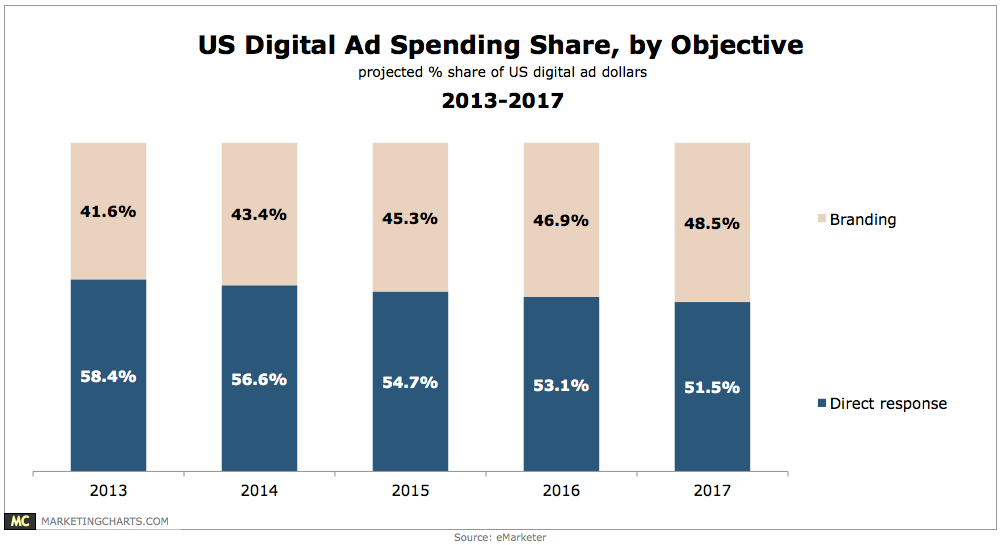
Digital ad spending is currently weighted towards direct response over branding, but that tilt will soon disappear.
Read MoreLGBT Advertising Interaction Behavior By Gender, June 2013 [TABLE]
About four out of 10 gays, lesbians and bisexual men and women had “liked” a business on Facebook.
Read MoreMedia Consumption Of LGBT Americans, June 2013 [TABLE]
The most common activity among the men and women polled was visiting LGBT sites and blogs, at 67% of gays and 58% of lesbians.
Read MoreTop American Companies By Ad Spending, Q2 2012 & Q2 2013 [TABLE]
Retail remained the top spending ad category, but growth in Q2 2013 was minimal compared to a year prior, at only 0.1%.
Read MoreUS Ad Spending Growth By Media [CHART]
For the first half of 2013, Kantar Media estimated that the total US ad spend market rose 2.0%, compared with the same period one year earlier.
Read MoreLocation-Based Services Demographics, May 2013 [CHART]
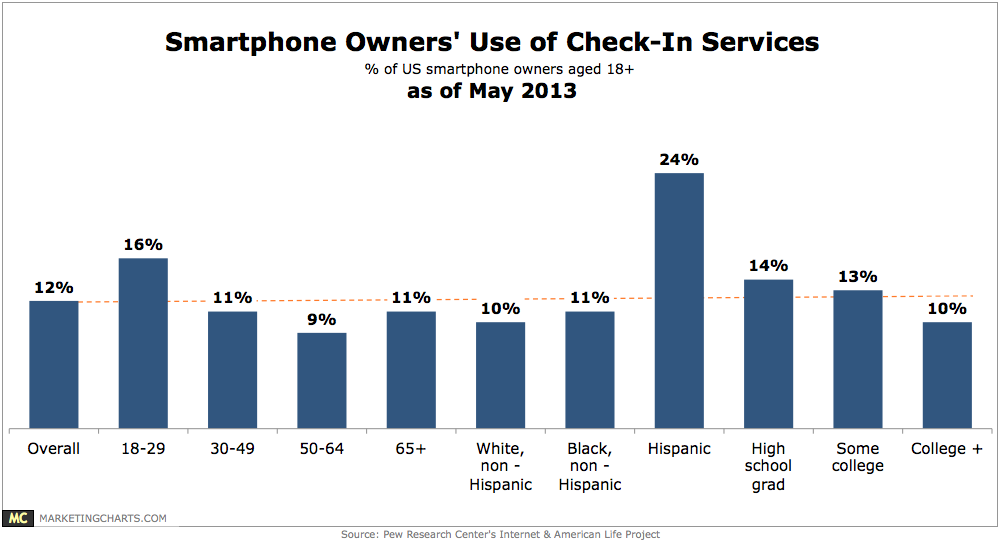
12% of smart phone owners use services such as Foursquare to “check in” to certain locations or to share their locations with their friends.
Read MoreB2B Print Ad Revenues, 2012 vs 2013 [CHART]
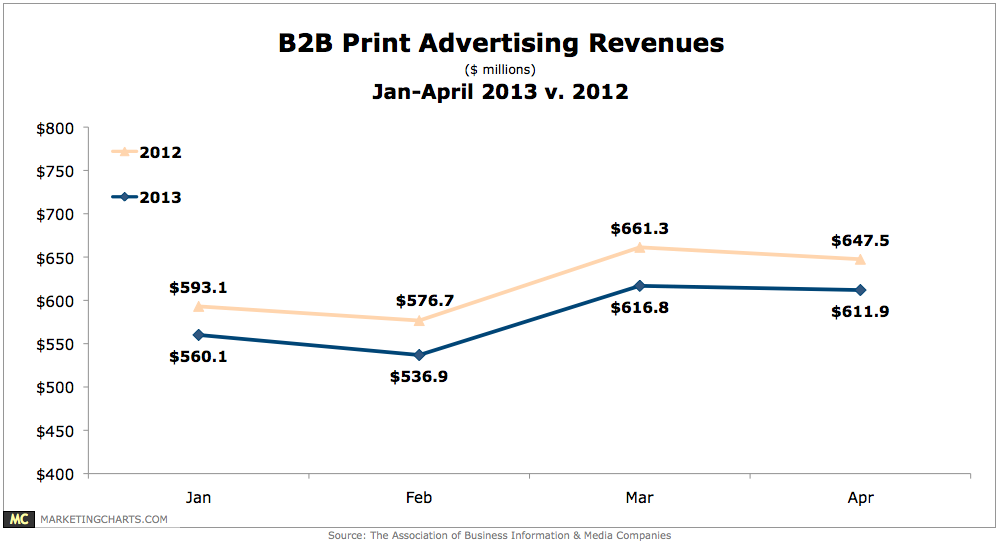
After declining by 4.8% last year, total Q1 ad sales this year dropped by 6.2%, from $1.83 billion to $1.72 billion.
Read MoreUS College Student Demographics [CHART]
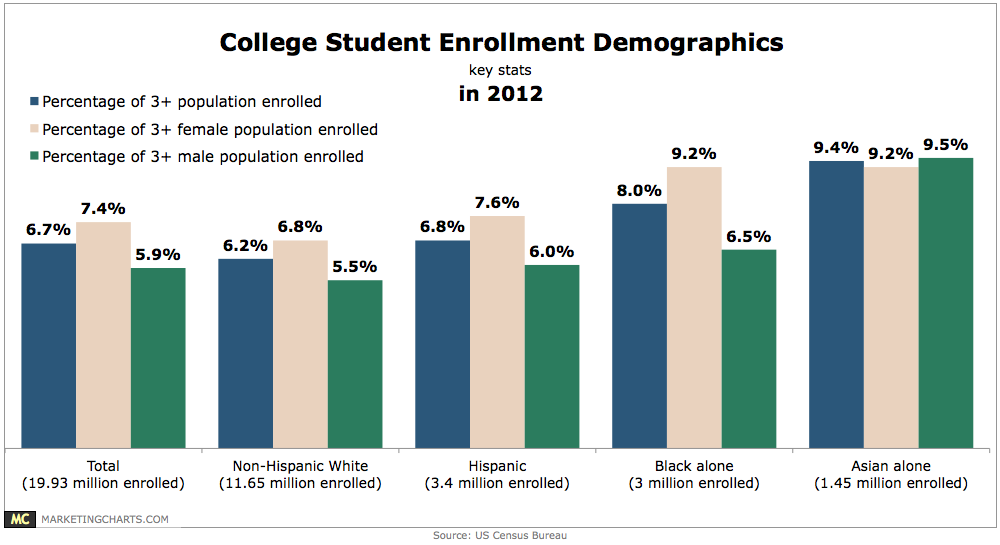
After growing by 3.2 million between 2006 and 2011, the number of Americans enrolled in college (undergraduate and graduate) fell by almost half-a-million last year.
Read MoreMobile Video Ad Views By OS, Q2 2013 [CHART]
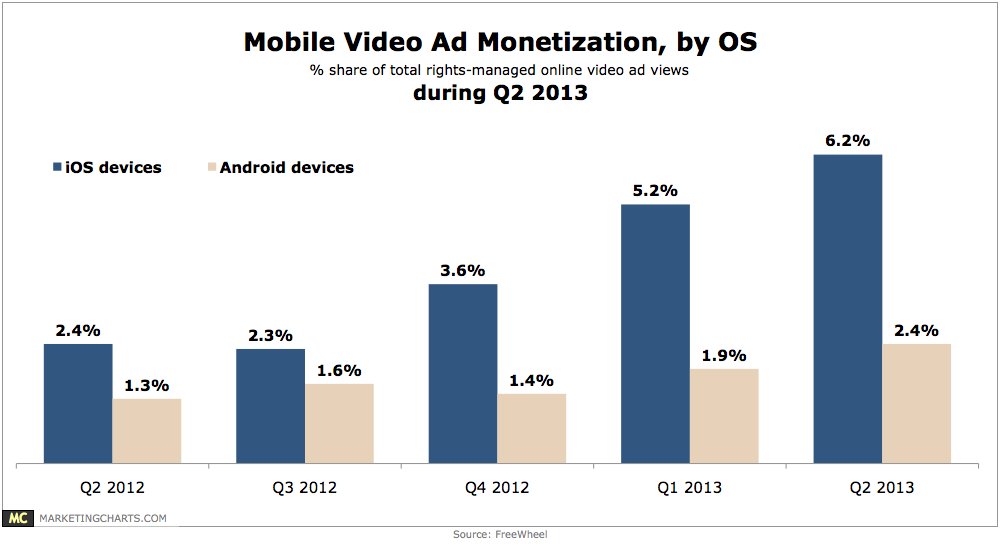
During the second quarter of the year, 17.5% of US rights-managed online video views occurred on a mobile phone (13.2%) or tablet (4.3%), almost double the 9.2% from Q2 2012.
Read MoreTelevision & Movie Streaming Audiences By Generation, September 2013 [CHART]
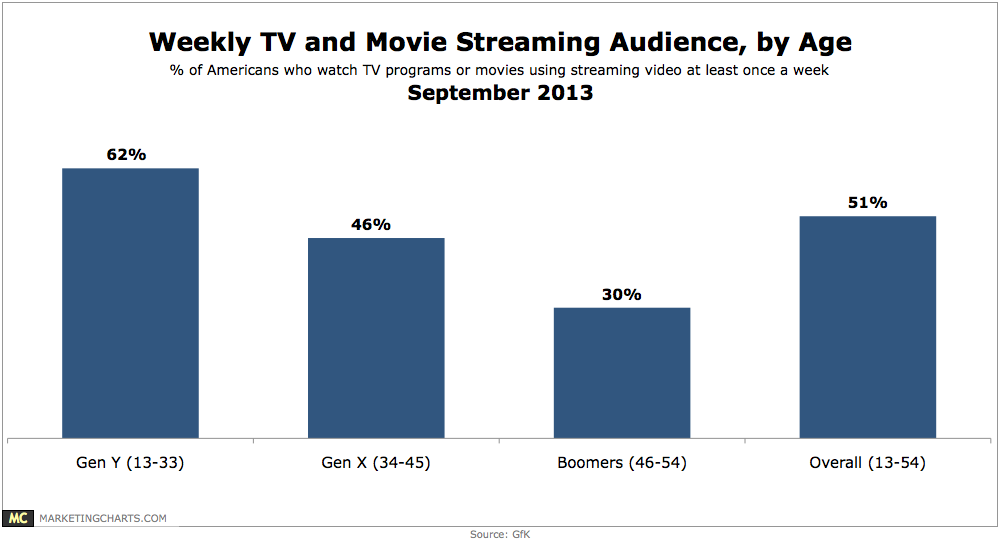
51% of Americans aged 13-54 now watch TV programs or movies using streaming video at least once a week
Read More