Posts Tagged ‘Web TV’
Anticipated Smart TV Market Growth, January 2013 [TABLE]
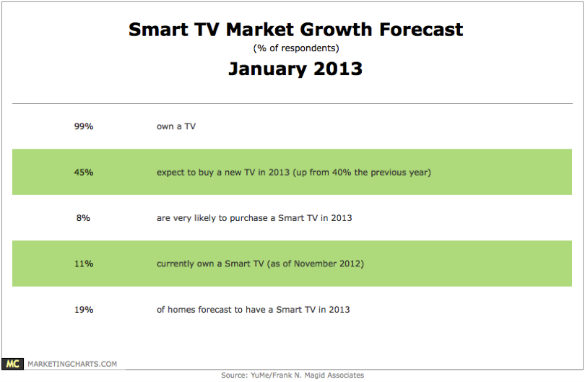
19% of homes will have a Smart TV this year.
Read MoreExpected Change In Connected TV Viewing Behavior By Device, November 2012 [CHART]
A nearly equal percentage of respondents expected to increase their connected TV viewing on consoles, Blu-ray players and internet video devices.
Read MoreTime Spent Online By Device, 2011 vs 2012 [CHART]
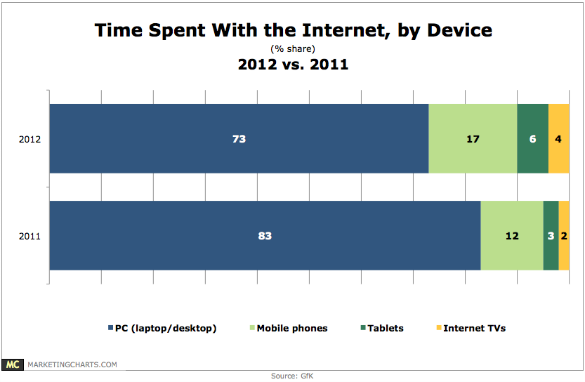
While desktop and laptop computers accounted for 83% of total time spent online last year, that dropped by 10% points to 73% this year.
Read MoreDigital Politics [INFOGRAPHIC]
This infographic from Pew Internet & American Life summarizes their research on the use of the Internet for politics.
Read MoreTime Spent Online [INFOGRAPHIC]
This infographic from Morrison Foerster’s Socially Aware blog looks at the time Americans spend online.
Read MoreLuxury Advertisers Who Will Increase Use Of Digital, By Format [CHART]
Video and mobile topped the list of formats luxury market advertisers expected to increase their use of this year, with more than two-thirds planning to do so.
Read MoreHow Internet TV Viewers React To Ads [CHART]
When seeing a message or ad for something that interested them or that they were planning to purchase, 71% of connected TV users report having taken an action as a result of the ad and 19% say they have purchased the product mentioned in the ad.
Read MoreTypes Of Ads Seen By Internet TV Viewers [CHART]
57% of US connected TV viewers encountered pre-program ads, compared to half who remembered seeing mid-stream ads.
Read MoreTime Spent Watching Online Videos Worldwide By Length & Device [CHART]
Ooyala found the majority of connected TV content is greater than 10 minutes in length, unlike most video content on desktop and mobile devices.
Read MoreHow TV Viewers React On Their Connected TVs After Viewing Ads [CHART]
30% of US connected TV viewers visited an ad’s website post-exposure, and a quarter considered the advertised product for purchase.
Read More