Posts Tagged ‘Video Game Consoles’
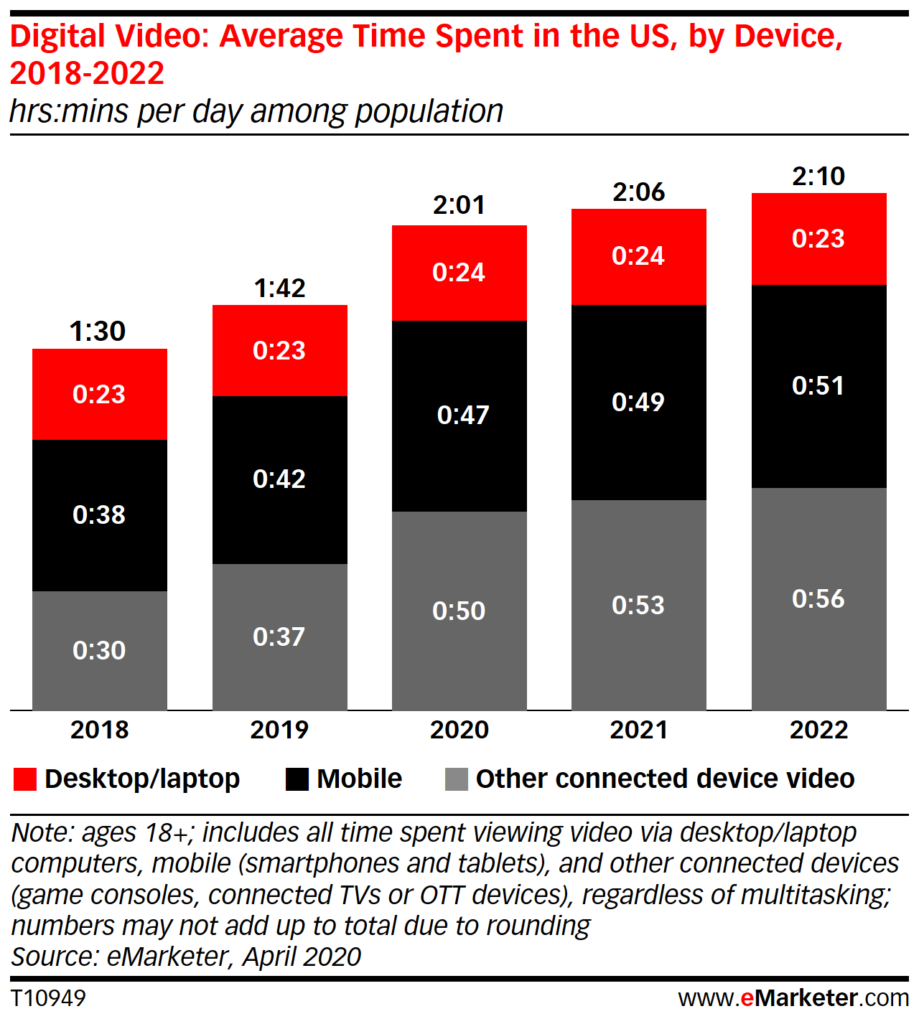
Time Spent With Digital Video By Device, 2018-2022
This year, time spent with mobile video apps will gain 10 minutes, second only to social media. Overall, mobile video will gain 5 minutes, since video watched via mobile web has decreased as people continue to shift such viewing to apps or other devices.
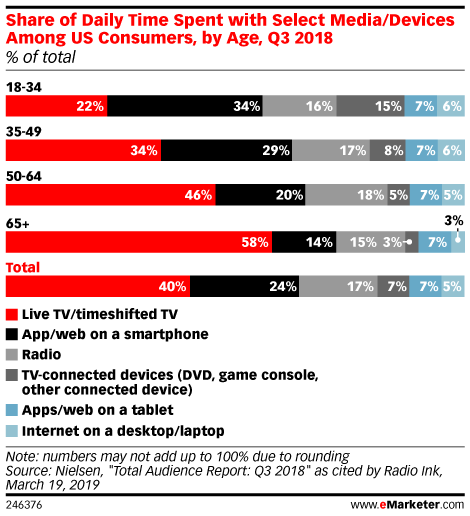
Read MoreMedia Consumption By Device Age Range [CHART]
According to Q3 2018 research from Nielsen, US consumers ages 35 to 49 spend nearly the same amount of time with old media like live and timeshifted TV and radio, as with their digital devices by accessing apps and the web on a smartphones or tablet.
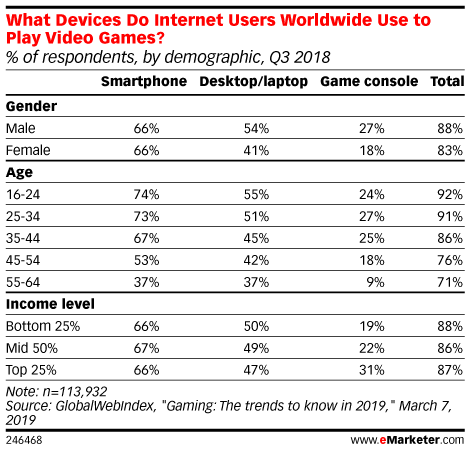
Read MoreVideo Game Platforms by Demographics [TABLE]
Gaming has gone mainstream, with 86% of internet users worldwide noting that they have gamed on at least one device within the past month.
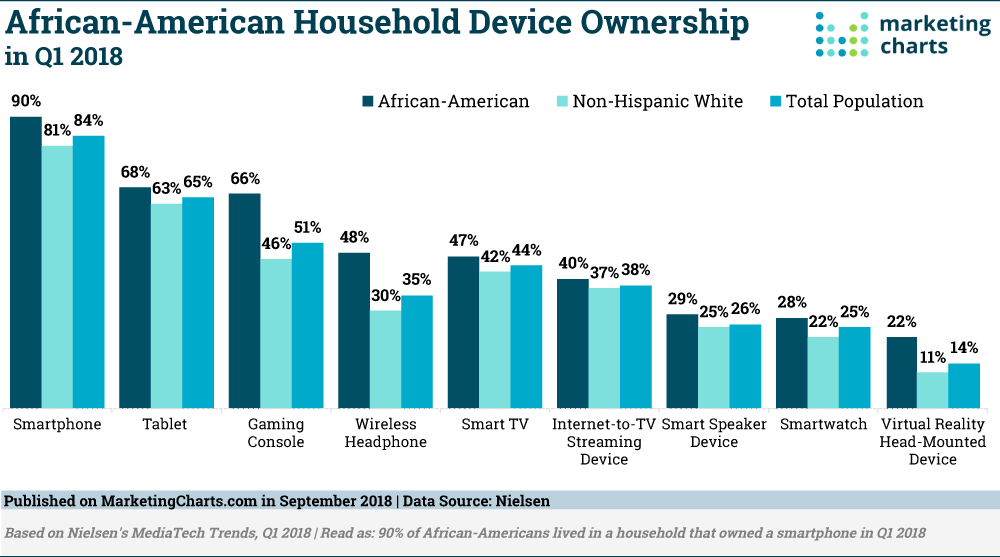
Read MoreAfrican American Device Ownership [CHART]
African-Americans outpaced non-Hispanic Whites and the total population in ownership of each of the 9 devices identified, including smartphones, tablets, smart TVs, and streaming devices.
Read MoreVideo Gamers' Share Of The US Population, 2013-2018 [CHART]
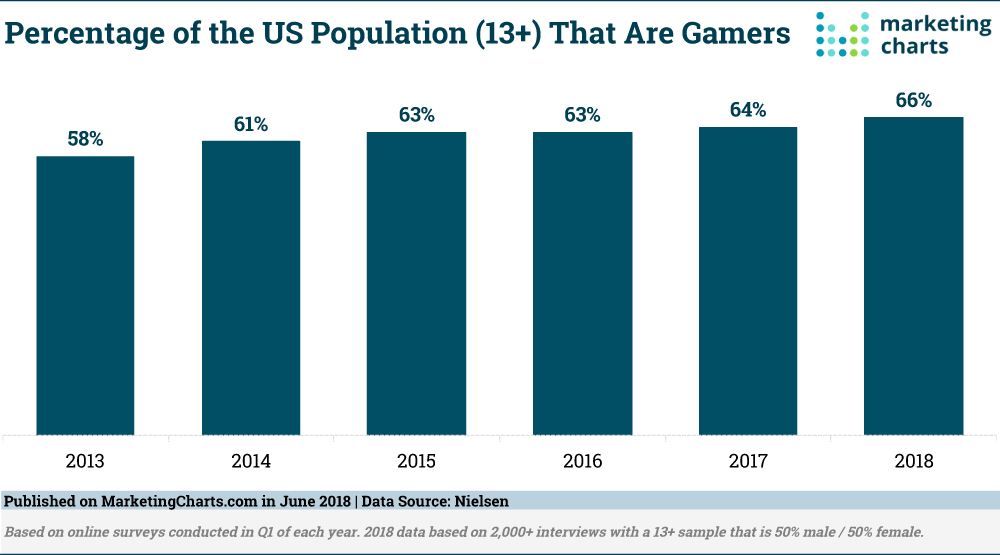
The gaming audience continues to expand. In fact, two-thirds (66%) of Americans ages 13 and older self-identify as gamers, up from 58% in 2013, according to a Nielsen study. Gamers are spending an average of 11% of their leisure time with video games this year, a figure that has remained largely consistently over the past few years.
Read MoreMicrosoft Technologies [INFOGRAPHIC]
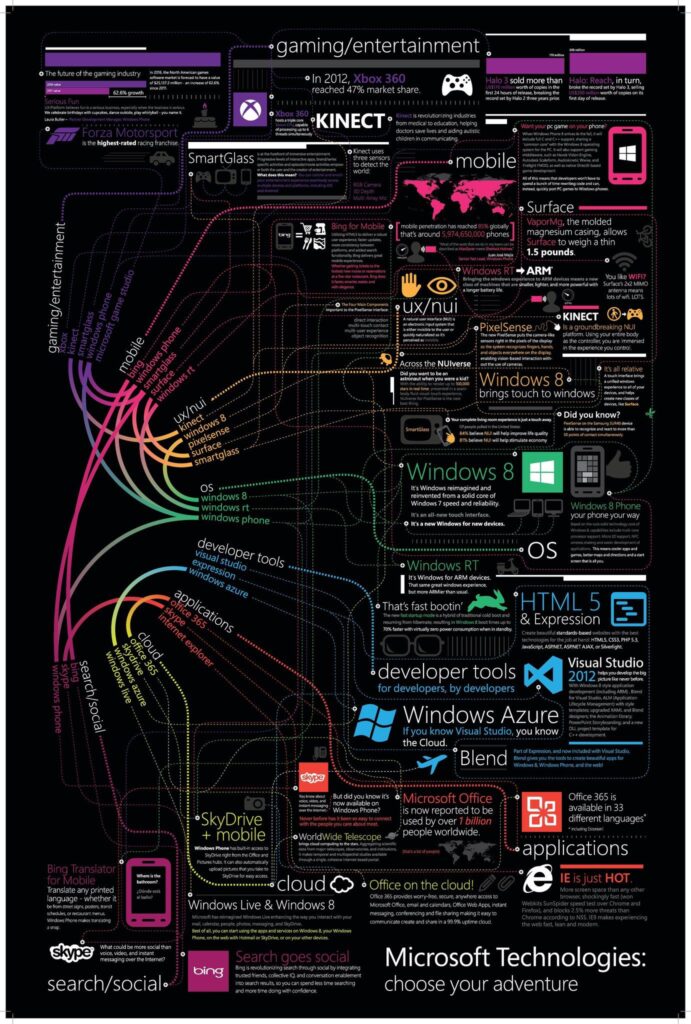
This infographic from Microsoft illustrates the breadth of the company’s technology, from gaming and entertainment, to operating systems and applications, to search and social.
Read MoreVideo Game Console Ownership By Age [CHART]
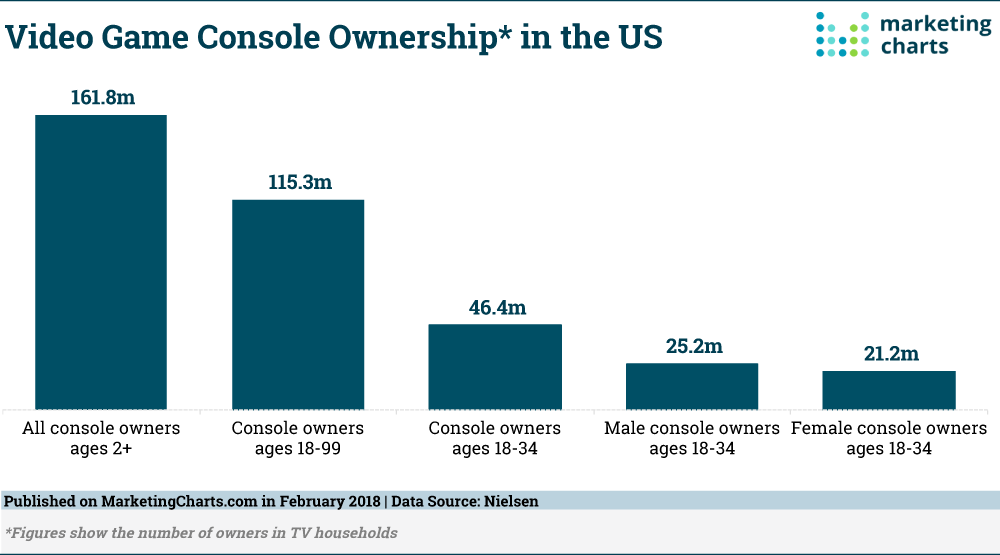
Video game hardware sales grew by 19% last year to reach $6.9 billion, per a recent report from the Entertainment Software Association. So how many Americans actually own video game consoles? Nielsen provides some answers.
Read MoreVideo Game Industry [INFOGRAPHIC]
This new infographic from Filmora illustrates the growth and potential of the video game industry.
Read MoreConnected TV Penetration [CHART]
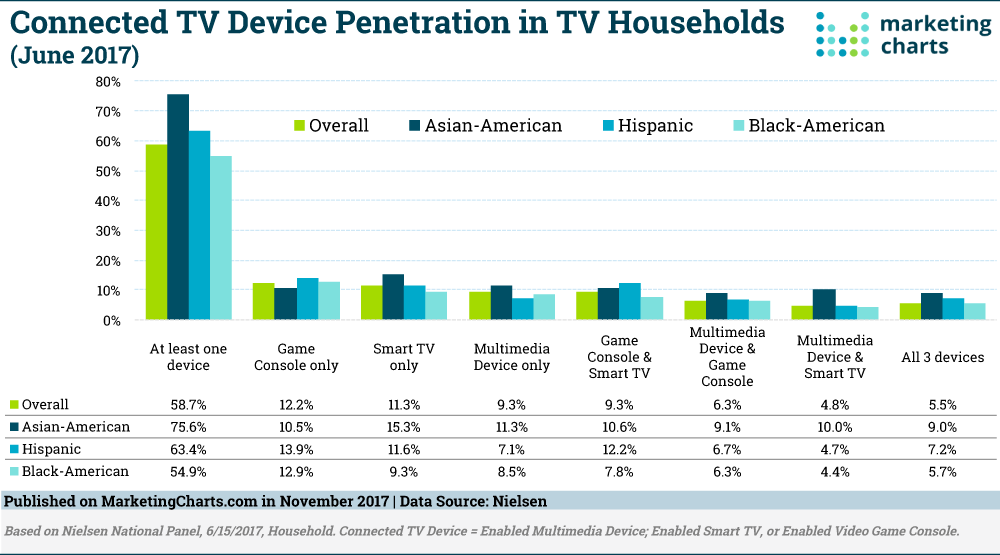
The share of TV households with a Multimedia Device, Game Console and/or Smart TV has broadened to 58.7%, up from 52.2% during the year-earlier period.
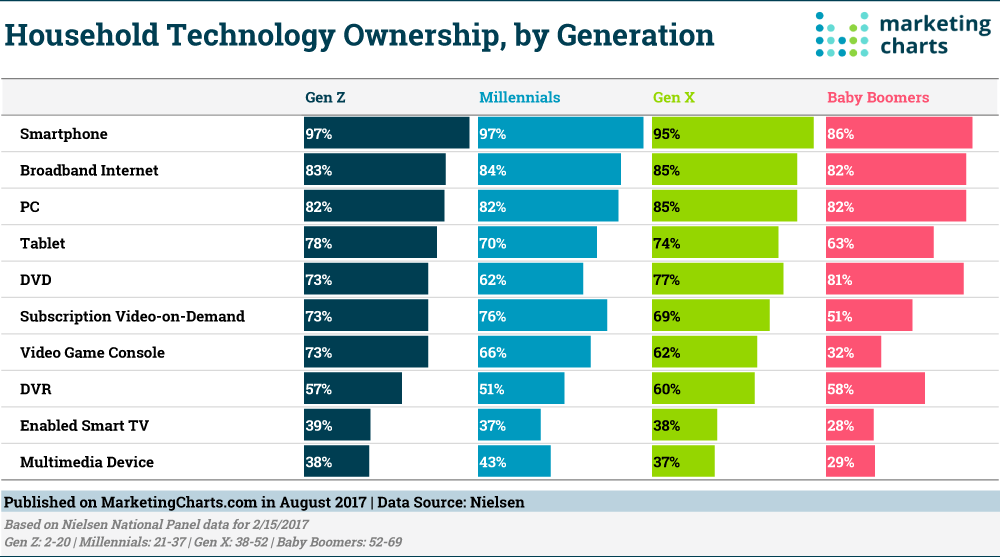
Read MoreHousehold Technology By Generation [CHART]
Smartphones are almost omni-present in US households, reveals Nielsen in a recent report.
Read More