Posts Tagged ‘United Kingdom’
UK Online Video Viewing Share By Device, Q3 2012-Q3 2013 [TABLE]
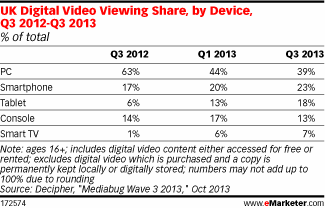
Smart phones were accounting for a growing proportion of digital video viewing among the general UK population—up from 17% in Q3 2012 to 23% in Q3 2013.
Read MoreFrequency Of Mobile Video Viewing In Select Countries, December 2013 [CHART]
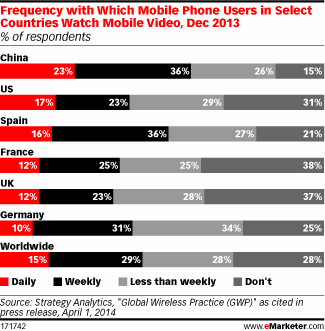
37% of UK mobile phone users don’t watch video content on their phones—a proportion almost 10 percentage points higher than the worldwide average.
Read MoreHow Select Europeans Watch TV, February 2014 [TABLE]
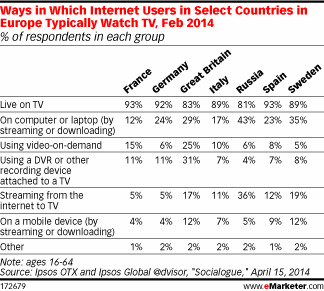
Just 15% of internet users in France typically watched television via VOD.
Read MoreUK Tablet Users, 2012-2018 [TABLE]
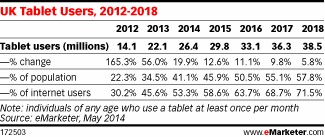
Driven by the popularity of the iPad, UK tablet usage saw explosive growth over the past few years.
Read MoreUK iPad Users, 2012-2018 [TABLE]
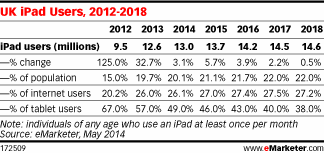
This year, for the first time ever, most people in the UK who use a tablet won’t be using an iPad.
Read MoreUK Mobile Ad Spending By Format, 2012 & 2013 [TABLE]
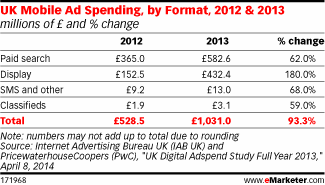
Growth in display ad spending within the mobile space is even more pronounced than in the overall ad spend equation—IAB UK and PwC indicated an increase of 180.0% in the UK in 2013.
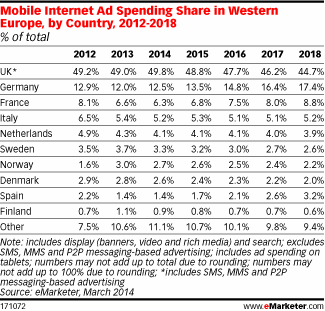
Read MoreWestern European Mobile Online Ad Spending Share By Share, 2012-2018 [TABLE]
UK mobile ad spending grew 126.1% in 2013 to account for 19.0% of all digital ad spending in the country; this proportion will increase to 31.9% in 2014.
Read MoreUK Online Ad Spending By Format, 2012 & 2013 [TABLE]
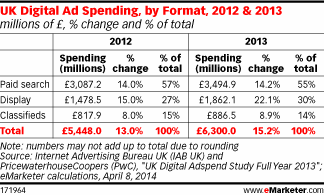
Total digital ad spend in 2013 rose by 15.2% to £6.30 billion ($9.84 billion), up from £5.45 billion ($8.51 billion) in 2012.
Read MoreUK Average Weekly Mobile Banking Transactions, 2012 & 2013 [CHART]
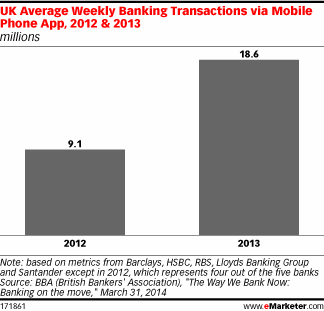
BBA found that the average number of mobile banking transactions conducted weekly via mobile app more than doubled between 2012 and 2013, from 9.1 million to 18.6 million.
Read MoreAd Spending Growth In Western Europe By Country, 2012-2018 [TABLE]
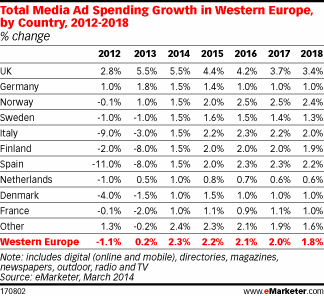
Total media ad spending in Sweden fell last year and amounted to no more than $3.77 billion, down from $3.80 billion in 2012.
Read More