Posts Tagged ‘Twitter’
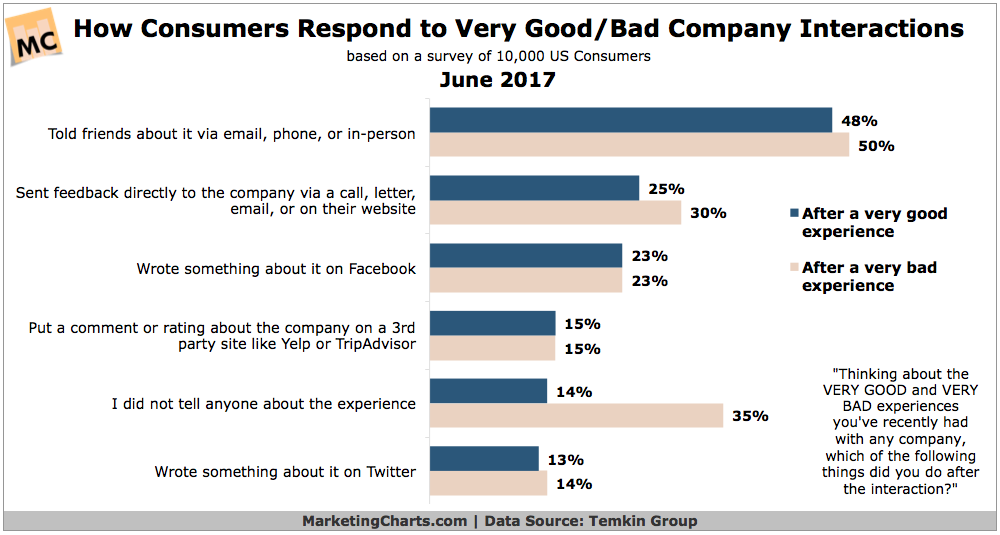
Customer Experience Responses [CHART]
In a reversal from past research consumers are more likely to share good experiences than bad ones.
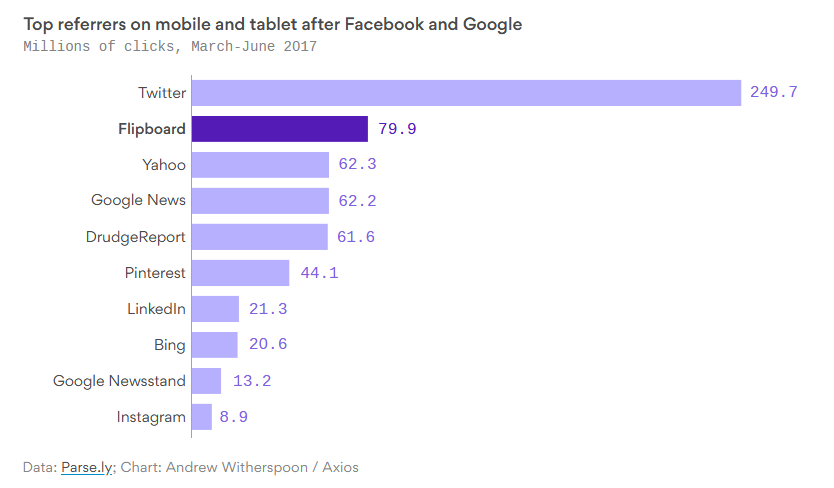
Read MoreTop Referrers Of Mobile Traffic (After Facebook & Google) [CHART]
Flipboard is becoming one of the biggest drivers of traffic to news stories on mobile.
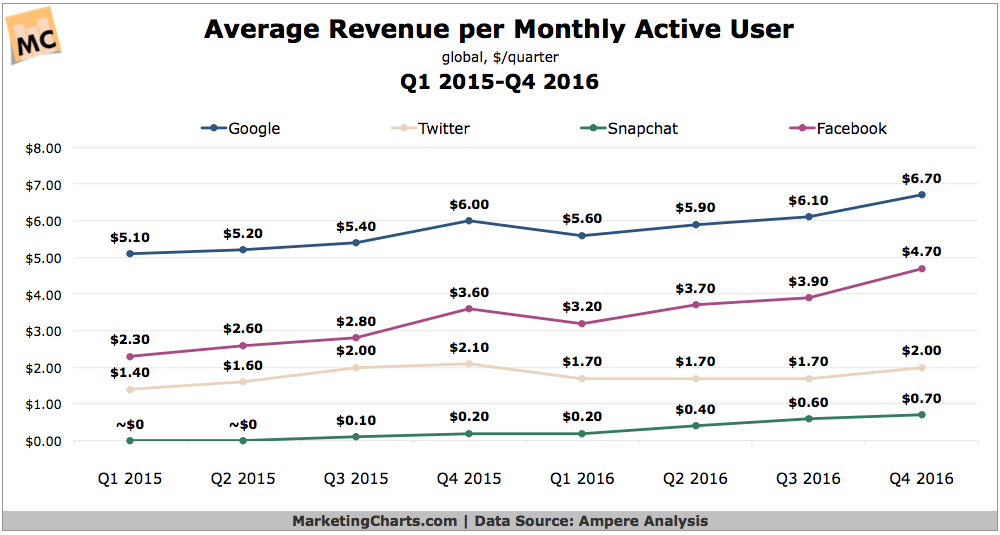
Read MoreAverage Revenue Per User For Top Social Channels [CHART]
Google raked in almost $7 per monthly active user from advertising on its sites.
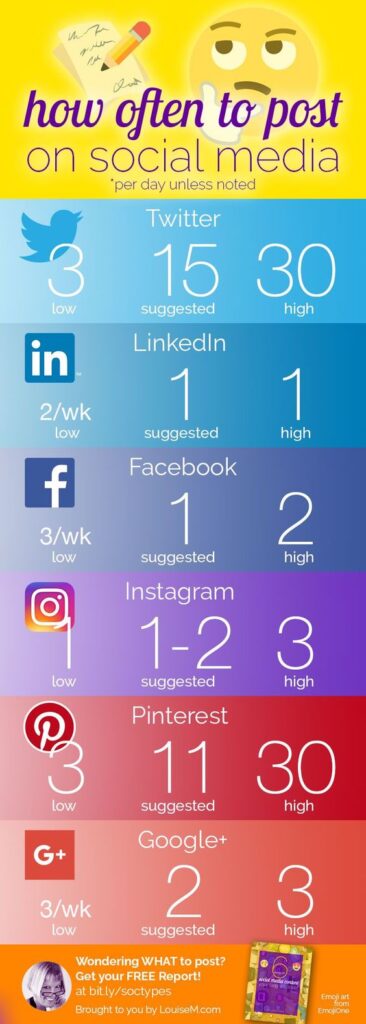
Read MoreSocial Media Posting Frequency [INFOGRAPHIC]
This infographic isn’t backed by any research but strikes me as true, based on how people use the differnet channels.
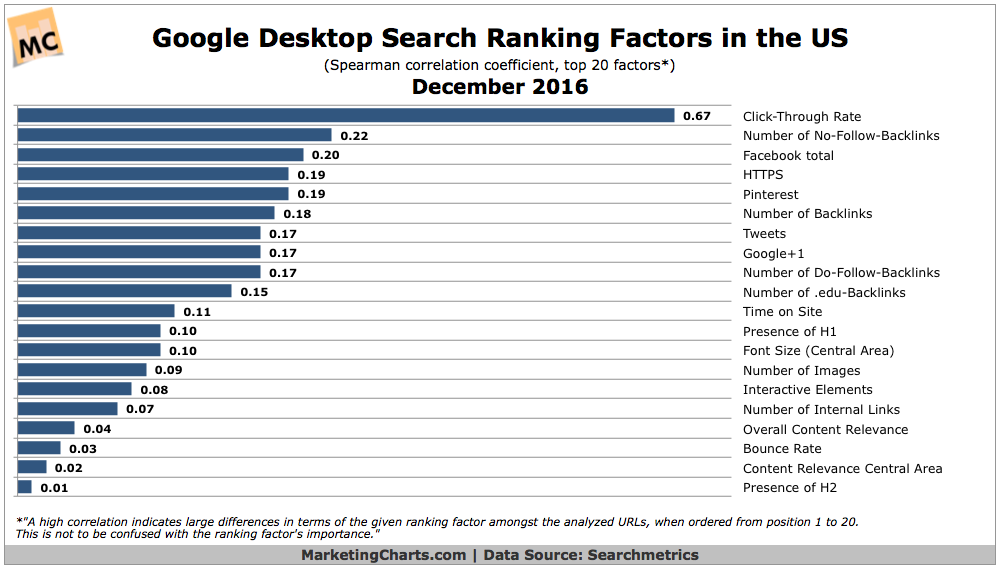
Read MoreGoogle Ranking Factors For Desktop Search [CHART]
Google search ranking factors no longer apply universally but must be analyzed on an industry-specific basis.
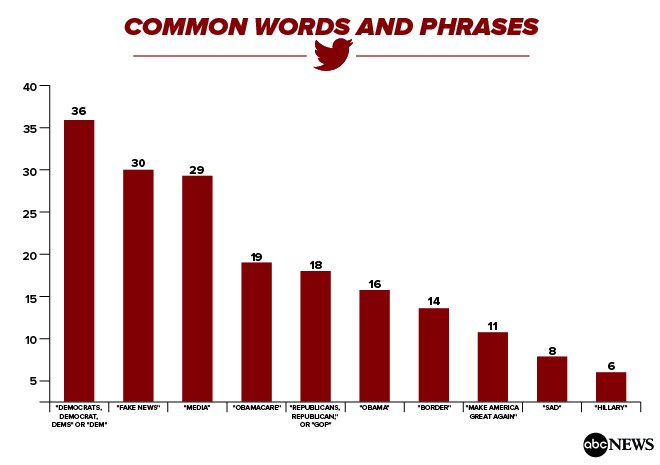
Read MoreMost Common Topics From 99 Days Of @RealDonaldTrump Tweets [CHART]
ABC News has created a tool to filter tweets from the first 99 days of @RealDonaldTrump’s presidency.
Read MoreOnline Reviews & Ratings [INFOGRAPHIC]
This infographic from Websitebuilder.org illustrates the facts and importance of online consumer reviews and ratings to a wide variety of businesses.
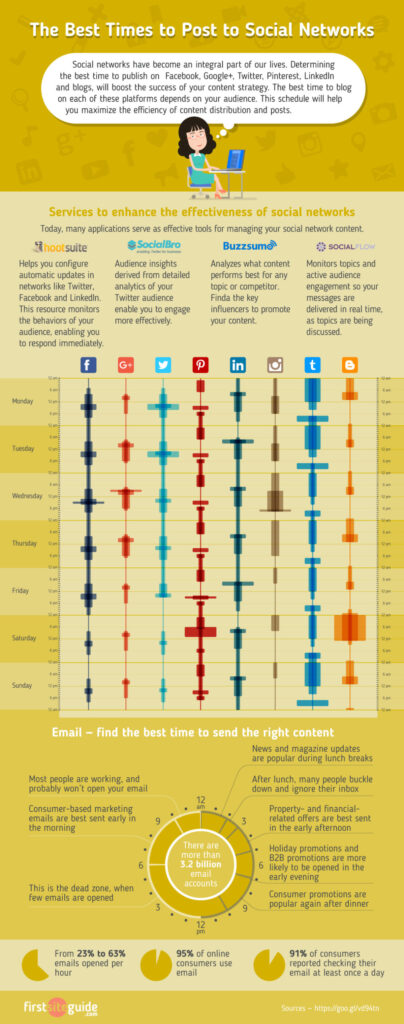
Read MoreSocial Media Dayparting [INFOGRAPHIC]
This infographic from First Site Guide illustrates the best times of the day and best days of the week to post to Facebook, Instagram, Twitter, LinkedIn, Pinterest, Google+, Tumblr, Blogger, and email.
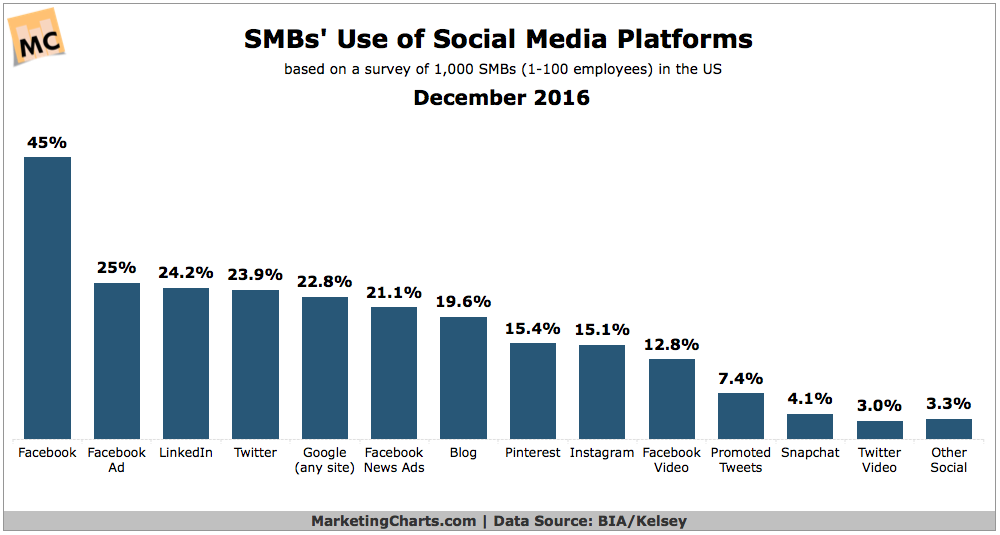
Read MoreSMBs' Use Of Social Media By Platform [CHART]
The use of social media marketing by small and medium-sized businesses (SMBs) in the US continues to grow.
Read MoreVisual Marketing [INFOGRAPHIC]
This infographic from Tailwind illustrates how to plan your visual marketing strategy with Pinterest and Instagram.
Read More