Posts Tagged ‘Television’
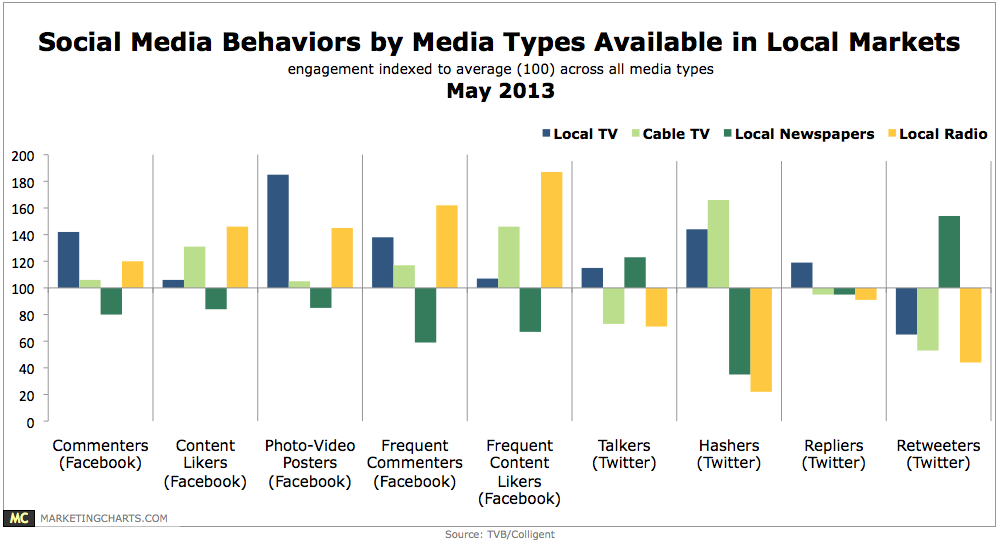
Local Media Fans Social Behaviors By Media Type, May 2013 [CHART]
What kind of social behaviors do local media fans exhibit on Facebook and Twitter? It depends on the medium.
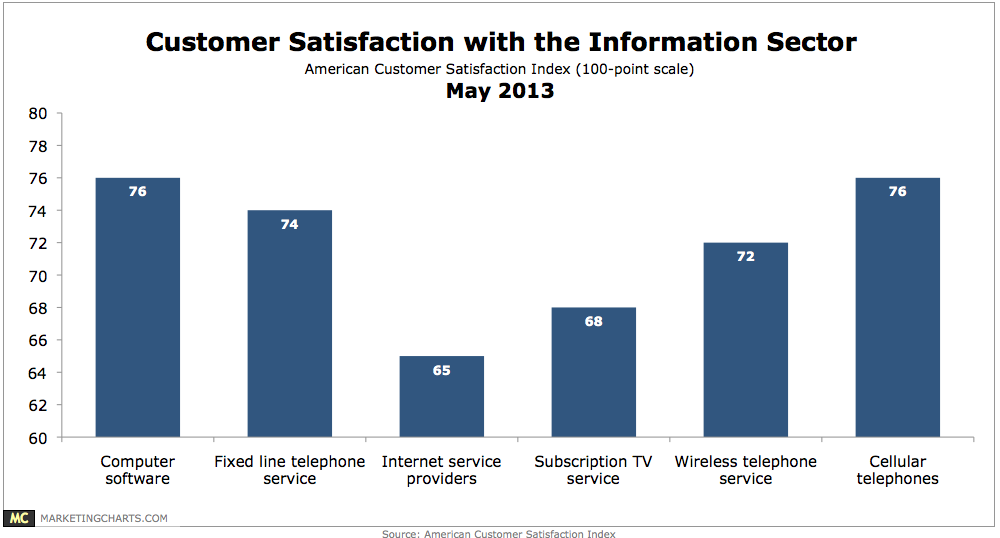
Read MoreCustomer Satisfaction With Information Sector, May 2013 [CHART]
Customer satisfaction with pay TV providers remains relatively low, although it has increased slightly after remaining flat for 3 consecutive years.
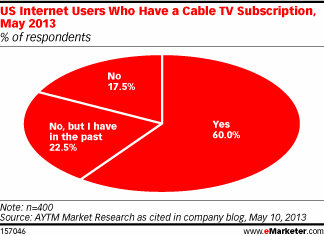
Read MoreOnline Americans Who Subscribe To Cable TV, May 2013 [CHART]
While 60% of US internet users still had a cable TV subscription in May, another 23% said they had a subscription in the past, but not any longer.
Read MoreHow People Watch TV, May 2013 [CHART]
An average of just 44% of viewing of full-length TV shows is live.
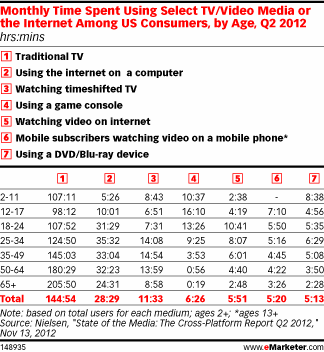
Read MoreAmericans' TV & Video Media Consumption By Generation, Q2 2012 [TABLE]
In Q2 2012, the average US mobile subscriber spent 5 hours and 20 minutes per month watching video on a mobile phone.
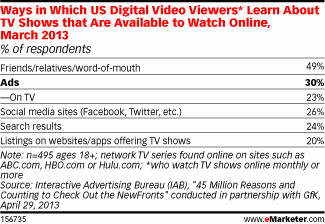
Read MoreWays Online Video Viewers Learn About Digital TV Programming, March 2013 [TABLE]
More than one-quarter of online video viewers 18 and older were informed via social sites about TV shows they could watch on the web.
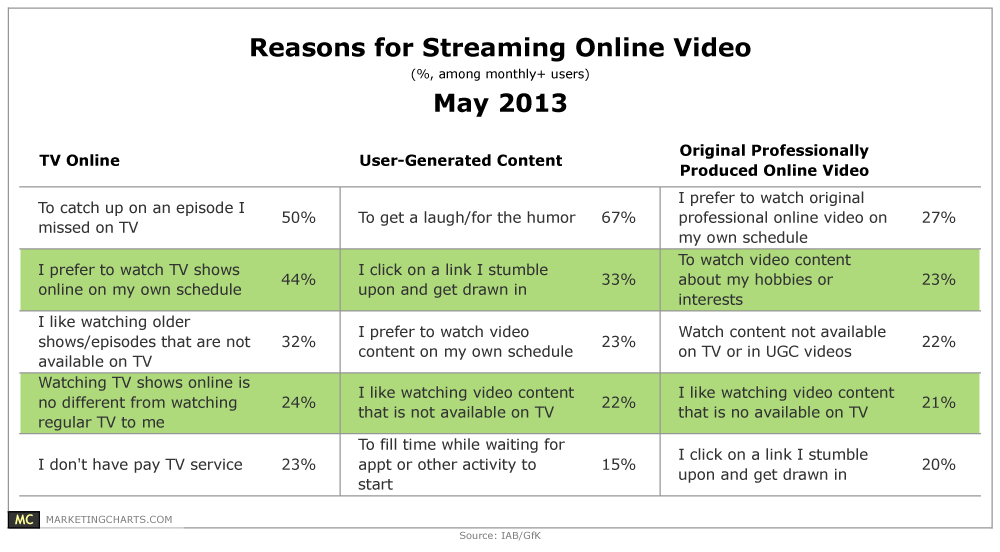
Read MoreWhy People Stream Online Video By Content Type, May 2013 [TABLE]
Among monthly users, network TV shows online have the same “wantedness” score as sports on regular TV, and also rivals regular primetime TV, meaning that these viewers attach a similar importance to online and regular TV content.
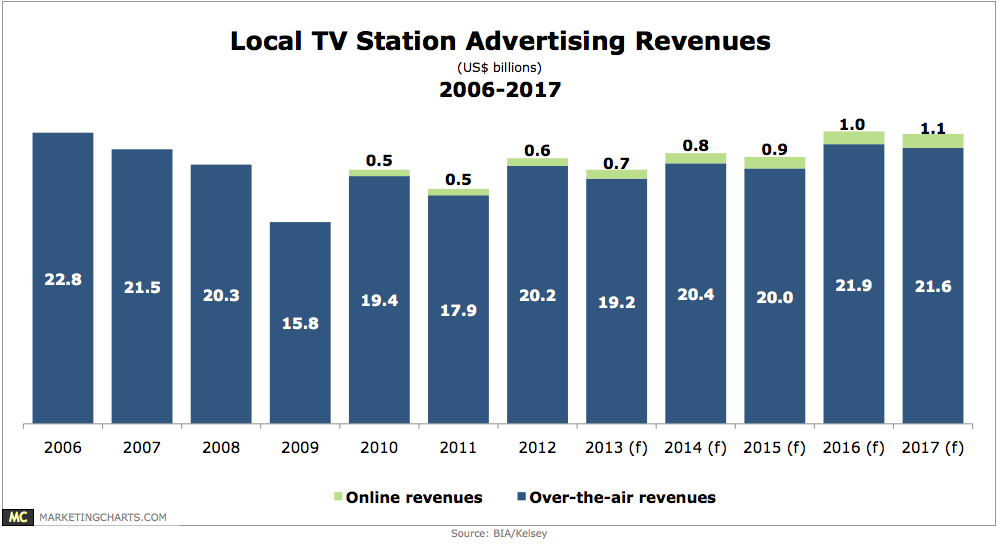
Read MoreLocal TV Ad Revenues, 2006-2017 [CHART]
Political advertising fueled a 13% increase in local TV ad revenues last year, to $20.8 billion.
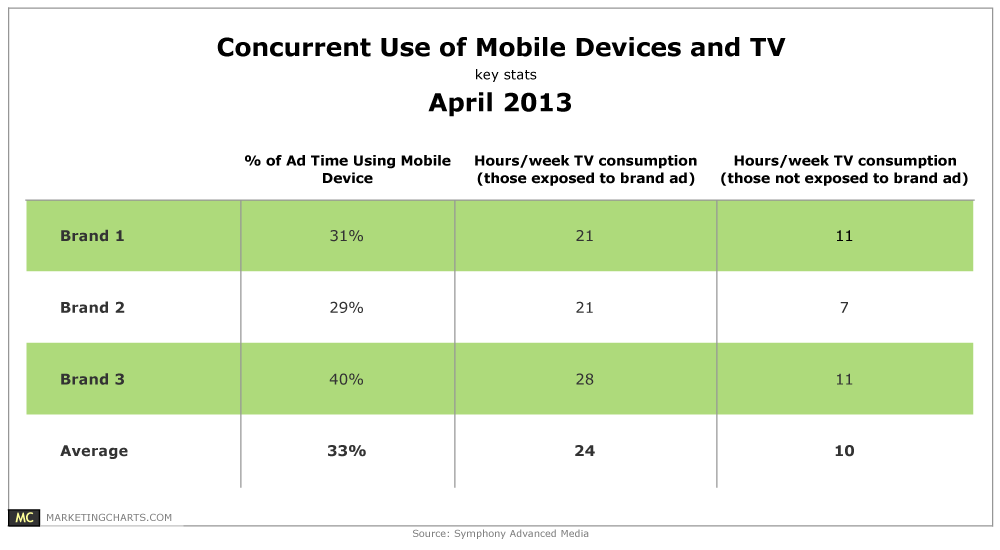
Read MoreTime Spent On Multitainment Activity, April 2013 [TABLE]
30-40% of actual TV ad viewing occurred concurrently with mobile device usage.
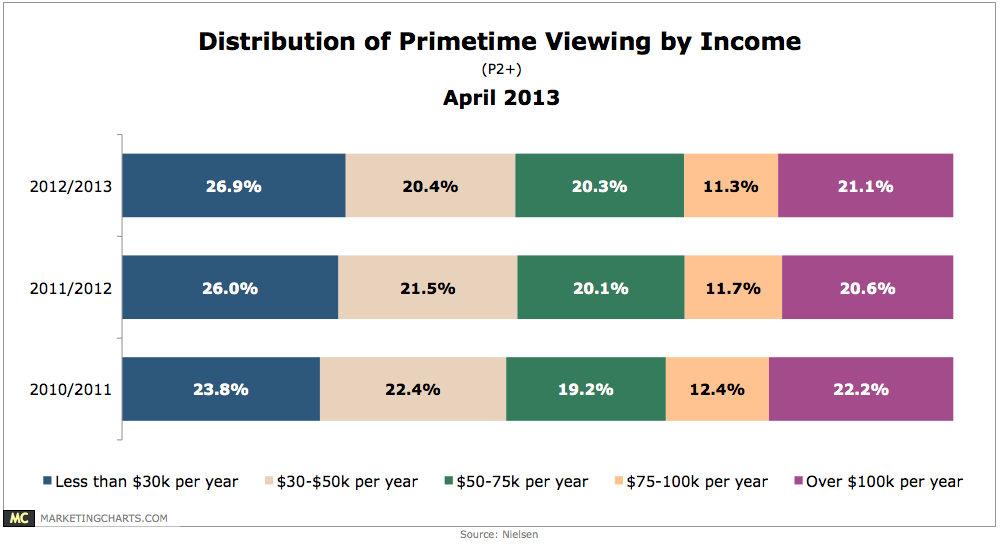
Read MorePrimetime TV Viewers By Income, April 2013 [CHART]
Although they watch less TV during the day, wealthy households (income of more than $100k per year) still make up more than one-fifth share of primetime viewing.
Read More