Posts Tagged ‘Television’
Share Of Daily Time Spent With Major Media, 2010-2014 [TABLE]
In 2013, time spent with digital media among US adults surpassed time spent with TV for the first time—with mobile driving the shift.
Read MoreDemographics Of Live TV Viewers, April 2014 [CHART]
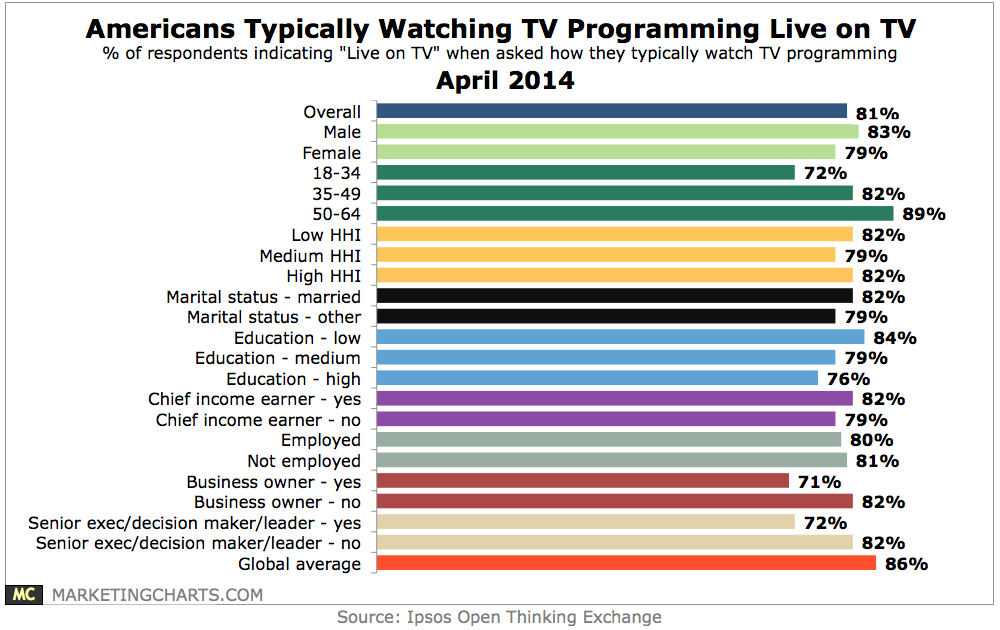
The vast majority of Americans usually watch TV programming the old-fashioned way: live on TV.
Read MoreMobile Spanish Users Who Pay Favorable Attention To Ads By Device, March 2014 [TABLE]
Nearly one-third (31%) of Spanish mobile users said they liked ads on TV, with the percentages for laptops and smartphones at 19% and 14%, respectively.
Read MoreFrench Mobile Users Who Pay Favorable Attention To Ads By Device, March 2014 [TABLE]
In France, 23% said they reacted favorably to ads on TV, while only 10% were well disposed to ads on their smartphones, and 9% welcomed ads on their laptops.
Read MoreTV Viewing On Alternative Devices, 2012-2014 [CHART]
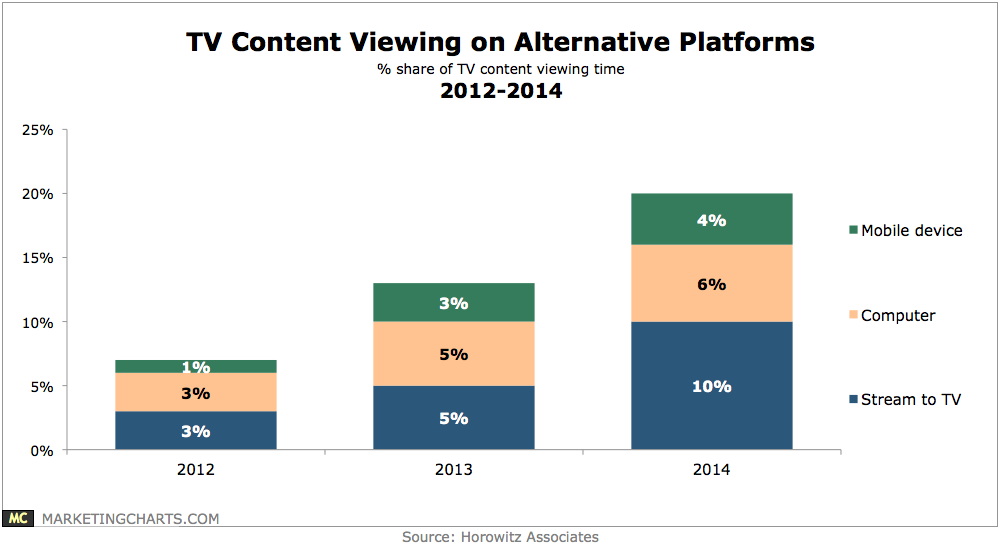
The 20% of TV content viewing time spent on alternative platforms is a significant step up from 13% last year, with the biggest change being for streaming to the TV set (10% this year, up from 5%).
Read MoreSocial TV Activities By Generation, December 2013 [TABLE]
The Council for Research Excellence/Keller Fay Group found that millennials were the age group most likely to engage with social media while watching TV.
Read MorePay-TV Subscriptions Among Millennial Heads Of Households, Q4 2012 – Q4 2013 [CHART]
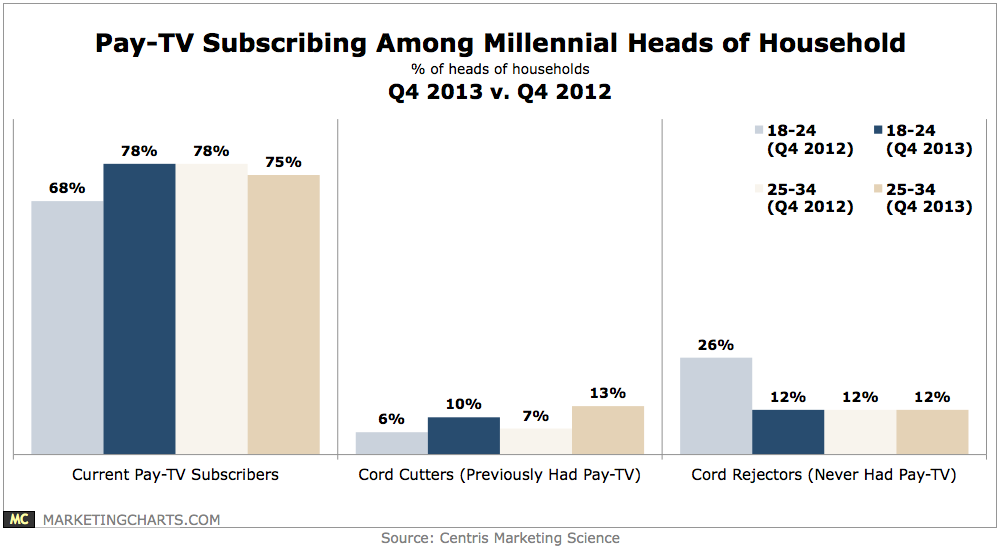
In Q4 2013, a significantly larger share of 18-24-year-old heads of household reported being pay-TV subscribers than did a year earlier, with a concurrent decrease in the proportion claiming to have never had pay-TV.
Read MoreSources Consumers Use For Local Shopping, April 2014 [TABLE]
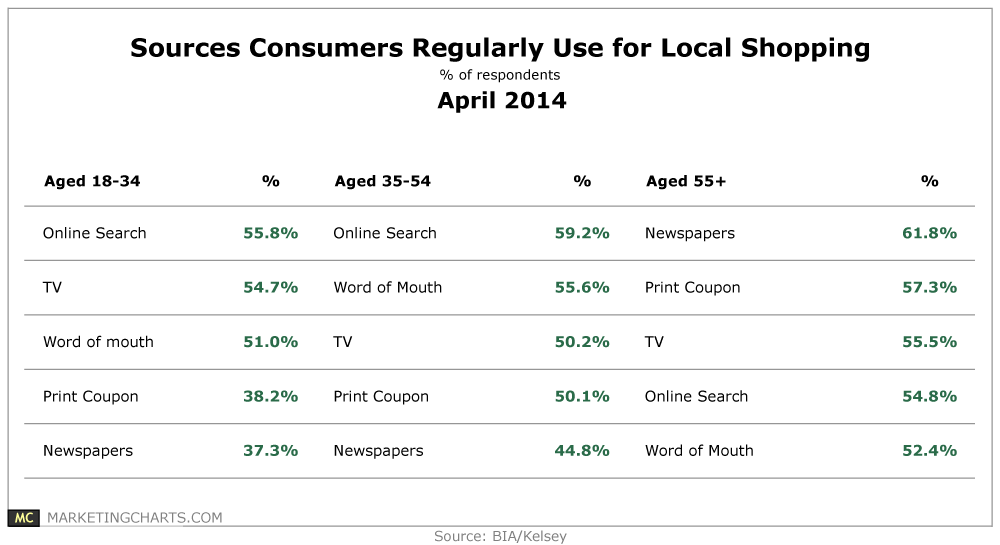
The relative ranking of sources most regularly used by Millennials and Gen X are quite similar, while Baby Boomers still turn to print first.
Read MoreLong-Form Video Share Of Time Watched By Device, Q4 2013 [CHART]
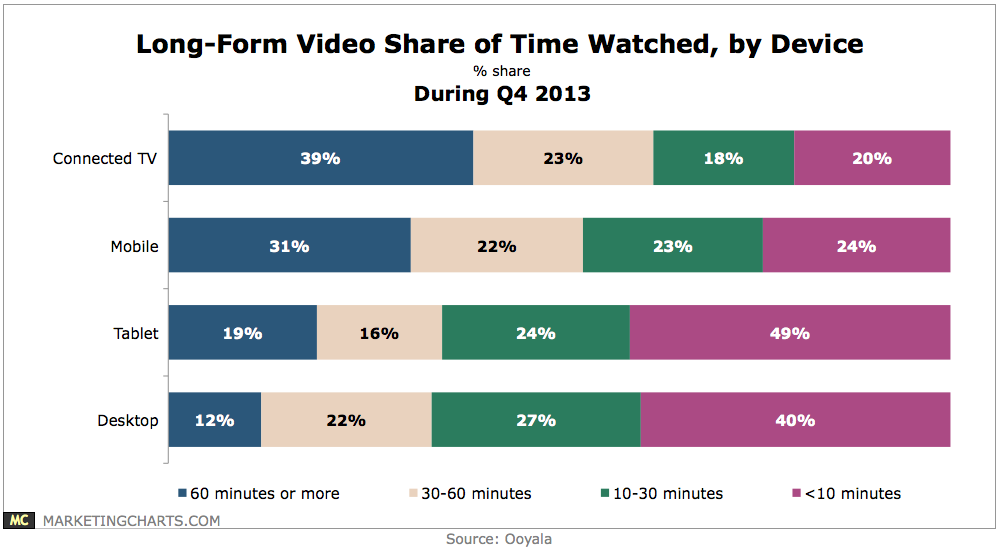
The majority of mobile video viewing time in Q4 2013 was spent with content at least a half-hour in length.
Read MoreMedia Gender Gap [INFOGRAPHIC]
Male journalists make up 63% of bylines in print, Internet and wire news media, according to a recent report from the Women’s Media Center.
Read More