
Posts Tagged ‘Television Marketing’
Why People Watch TV Online, August 2014 [CHART]
Among US internet users polled, 56% said they watched TV online because they preferred to watch on their own schedule.
Read MoreShare of Time Spent Watching Original TV Shows By Device, October 2014 [CHART]
Millennials (18-34) report spending two-thirds of their time watching original TV series on traditional TV.
Read MoreNetflix Original Programming Viewers By Age, Q1-Q3 2014 [CHART]
Some 72% of Netflix subscribers claim to have watched Netflix originals as of Q3, up from 61% in Q2 and 57% in Q1.
Read MoreVideo Viewing On Tablets, October 2014 [CHART]
Table ownership increased from 40% in 2013 to 50% in this year’s study.
Read MoreNetflix Original Programming Viewers, Q1 vs Q3 2014 [CHART]
Some 72% of Netflix subscribers claim to have watched Netflix originals as of Q3, up from 61% in Q2 and 57% in Q1.
Read MoreTV Average Audience Trends, Q3 2014 [CHART]
Overall TV viewership – measured by audience levels – is in fact steady.
Read MoreGlobal Netflix Hours Streamed Per Month Per Subscriber, 2011-2014 [CHART]
US Netflix subscribers’ total streaming hours have almost tripled from 1.8 billion in Q4 2011 to 5.1 billion in Q2 2014
Read MoreLive Primetime Social TV Activities, February 2014 [TABLE]
78% of US internet users accessed second screens during shows, compared with 71% who did so during ads.
Read MoreAffluents' Mobile Phone Activity By Age Group, November 2013 [CHART]

The big surprise in affluents’ media usage is the way older and younger age groups access media.
Read MoreEffect That Social TV Has On TV Show Follower Growth, September 2014 [CHART]
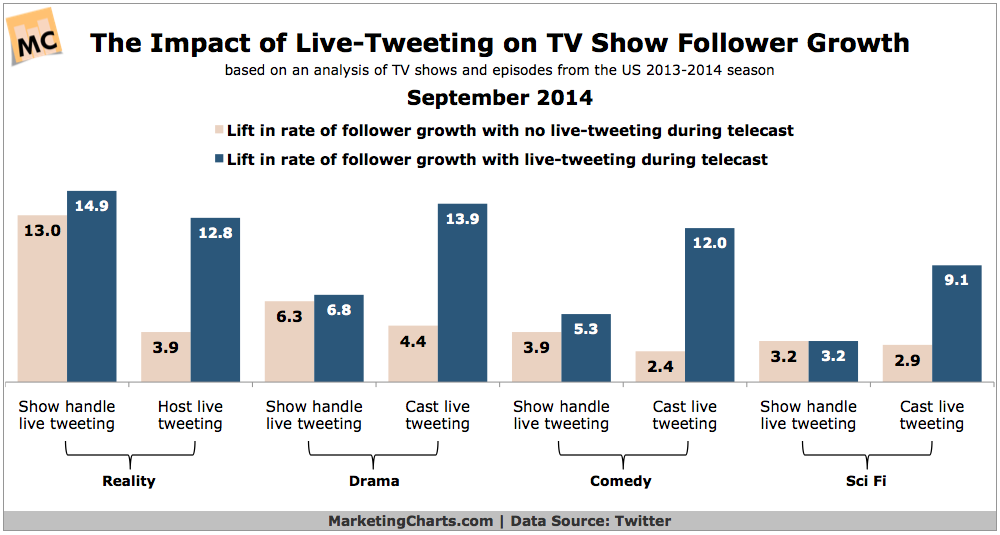
TV shows that live-tweet have a better follower growth rate than those that don’t.
Read More