Posts Tagged ‘Tablets’
2015 Holiday Shopping Trends [INFOGRAPHIC]
This infographic from think with Google illustrates five holiday shopping trends you’ll want to keep an eye on for the 2015 retail season.
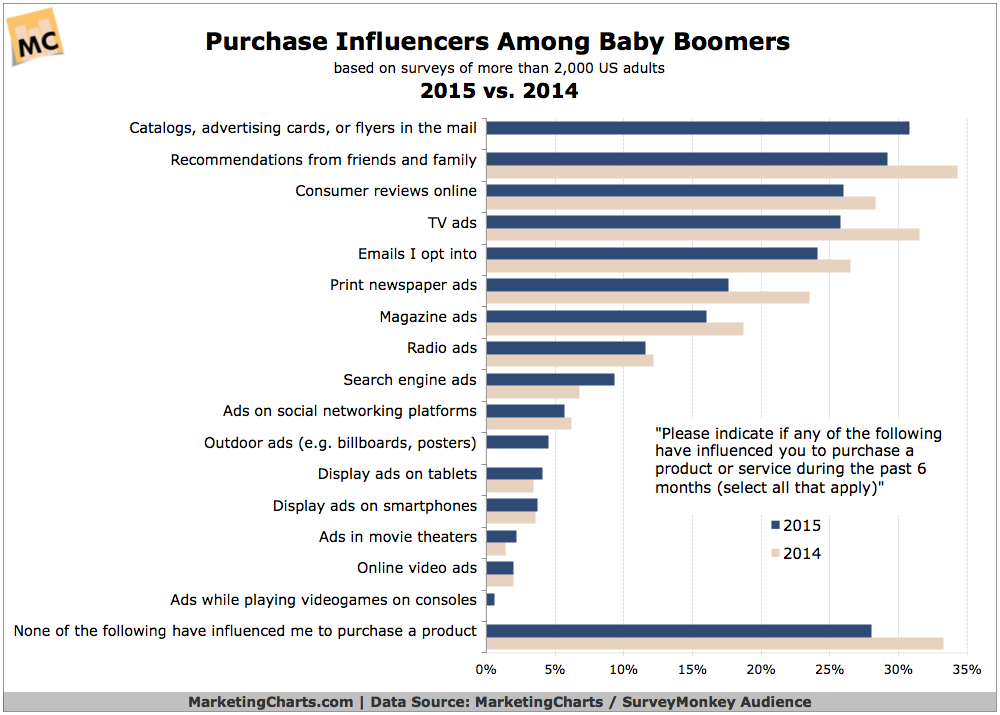
Read MoreBaby Boomers' Purchase Influences, 2014 vs 2015 [CHART]
Baby Boomers are projected to soon account for 70% of disposable income.
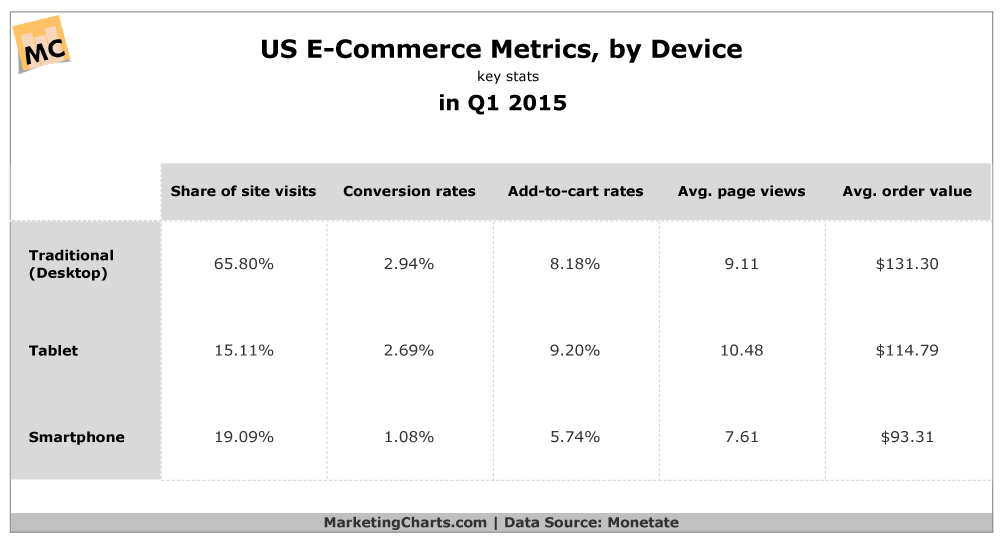
Read MoreUS eCommerce Metrics by Device, Q1 2015 [CHART]
Smartphones have grown to represent almost 1 in 5 visits to US eCommerce retailers.
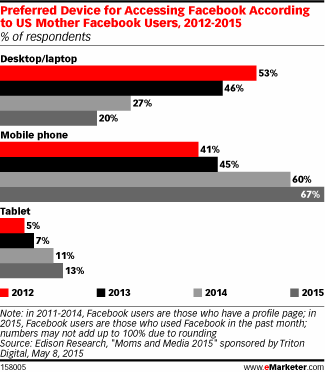
Read MoreDevices Mothers Use To Check Facebook, 2012-2015 [CHART]
In 2015, 67% of mother Facebook users logged on to the social network via mobile phone, up from 60% in 2014 and just 45% in 2013.
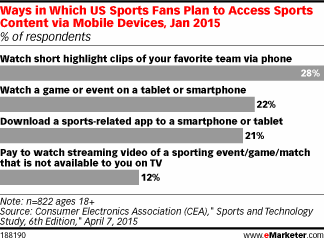
Read MoreHow Sports Fans Consume Mobile Content, January 2015 [CHART]
While a decent 40% of respondents had checked out sports digitally, just 16% had consumed content through a mobile device in the past 12 months.
Read MoreThe History of Online Advertising [INFOGRAPHIC]
This infograph by PointRoll illustrates the history of online advertising.
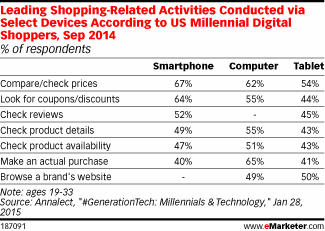
Read MoreMillennials' Top Shopping-Related Activities By Device [TABLE]
40% of Millennials said they use their smartphones to make an actual purchase vs. 65% doing so via computer.
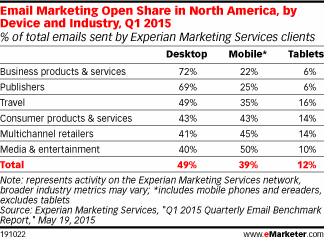
Read MoreEmail Marketing Open Share By Device & Industry, Q1 2015 [TABLE]
43% of CPG marketing emails were opened on mobile phones and eReaders—equal to that on desktop.
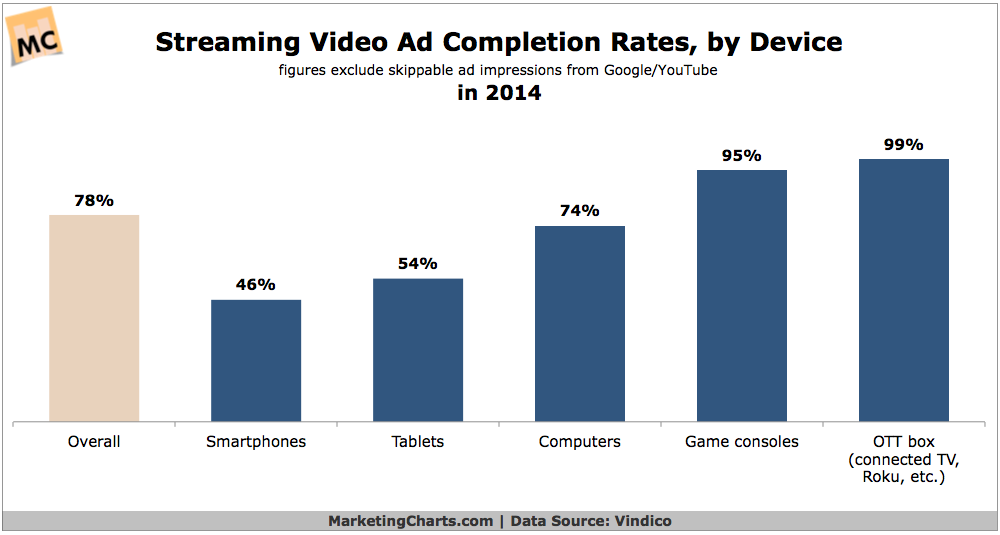
Read MoreStreaming Video Ad Completion Rates By Device Type, 2014 [CHART]
Streaming video ad completion rates were lower on devices with smaller screens last year.
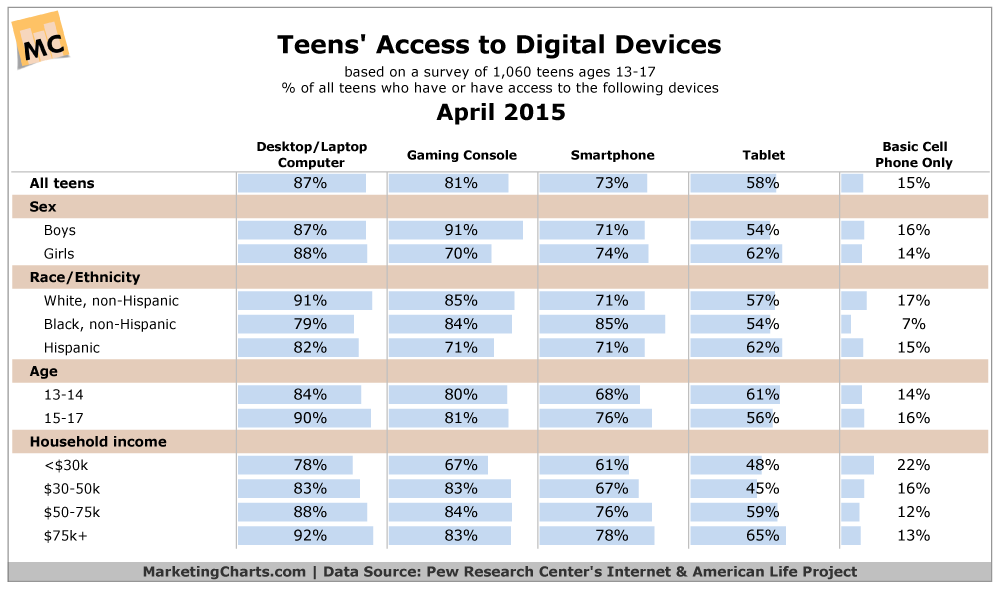
Read MoreTeen Access To Consumer Electronic Devices, April 2015 [TABLE]
Some 87% of teens aged 13-17 own or have access to a desktop or laptop computer, while 81% have access to a gaming console.
Read More