Posts Tagged ‘Retail Marketing’
Online vs. Total Marketing Budgets In 2012 For Select Industries [CHART]
On average, companies spent 10.4% of revenues on marketing activities in 2012. Of that budget, 2.5% of total revenues were spent on digital media initiatives.
Read More
Average Easter Spending, 2007-2013 [CHART]
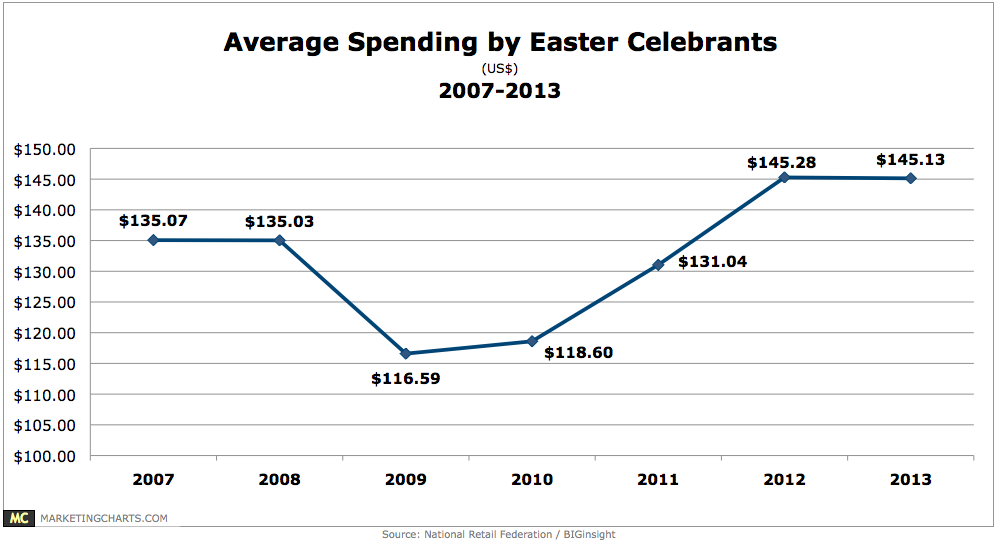
The average Easter celebrant is expected to spend $145.13 on items ranging from candy to clothes for this year’s Easter holiday, basically unchanged from last year’s $145.28.
Read MoreTop Prompts For Trying New Fashion Retailers, March 2013 [CHART]
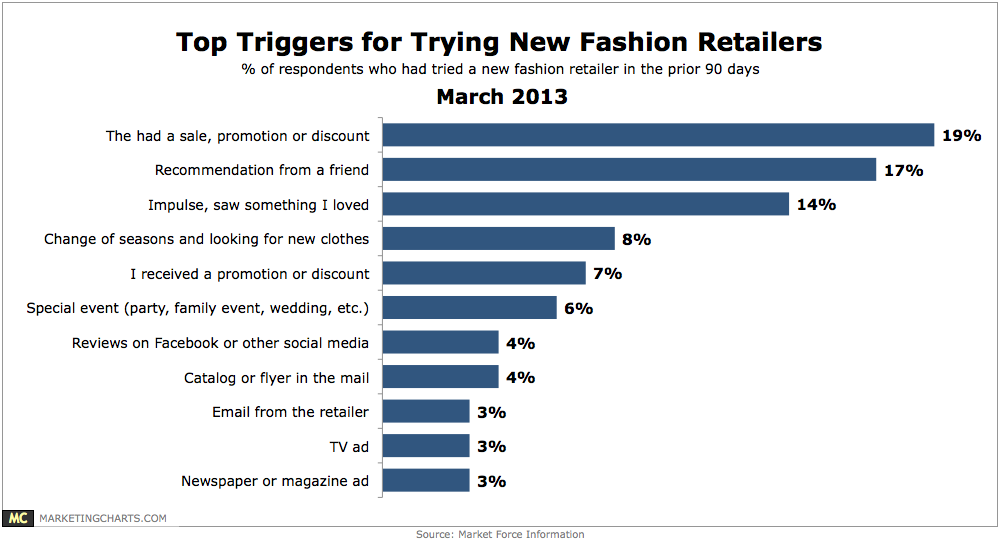
39% said they had tried out a new retailer in the previous 90 days, up 22% from 2011, and almost triple the 14% from 2010.
Read MoreRich Media Viewability By Vertical, September 2012 [CHART]
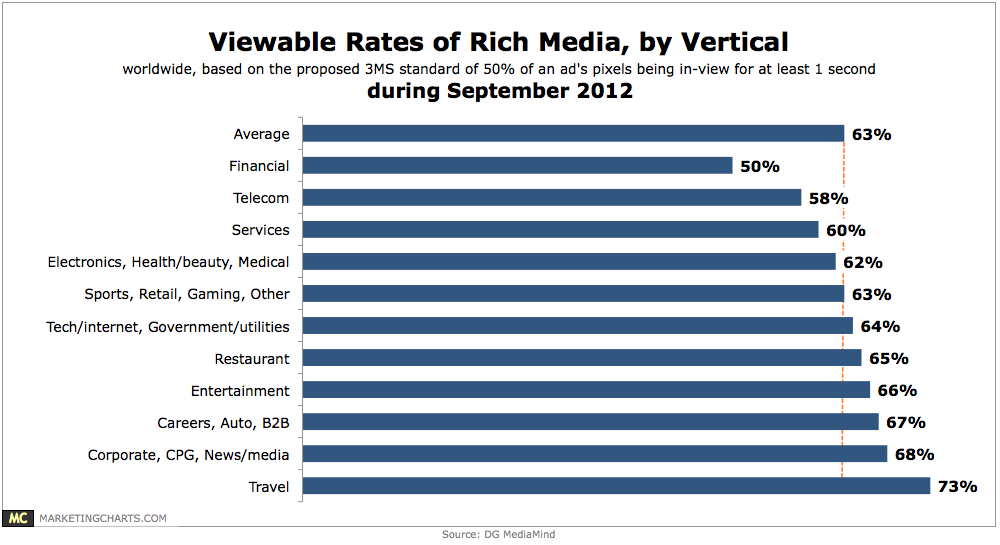
63% of rich media ads are viewable.
Read MoreHow eTailers Can Help Boost CPG Manufacturers' Sales, Q2 2012 [CHART]
100% of eTailers believed new product launches and exclusive product offerings would entice shoppers.
Read MoreMobile & Loyalty Programs [INFOGRAPHIC]
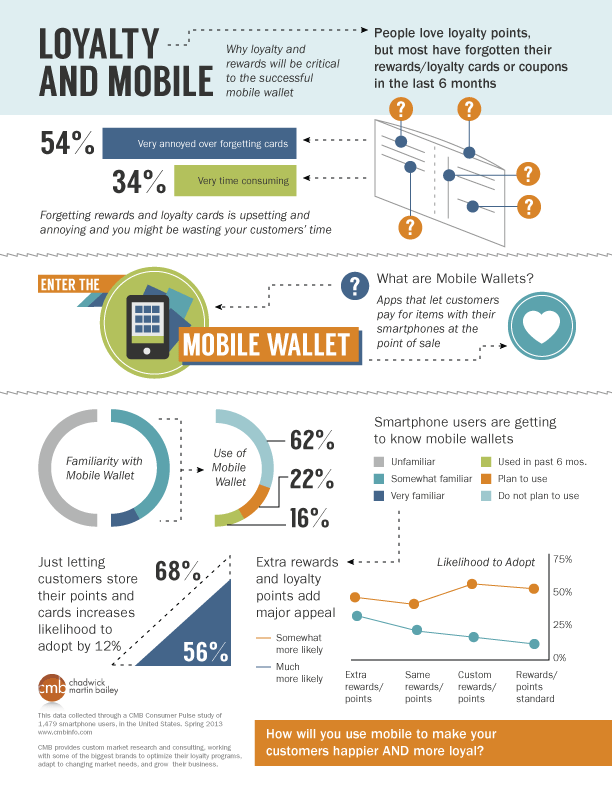
This infographic illustrates the potential of loyalty programs coupled with mobile wallets.
Read MoreViewability Rate For Rich Media Ads By Industry, September 2012 [TABLE]
Rich media ads purchased by firms in the travel industry were most likely to be viewable, at 10 percentage points above average, while those in the financial vertical were only seen half the time.
Read MoreLuxury Shoppers mCommerce Activities, 2011 & 2012 [CHART]
Mobile shopping activity among affluent luxury shoppers in the US saw substantial increases in 2012; the percentage of respondents shopping or purchasing via mobile increased from 22% to 38%.
Read MoreWhere People Mobile Shop, October 2012 [CHART]
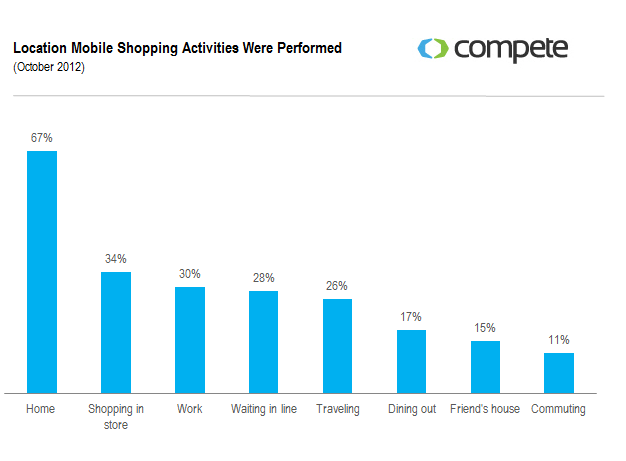
Nearly 1 in 5 consumers performs shopping activities on their phone while dining out.
Read More