Posts Tagged ‘Publishing’
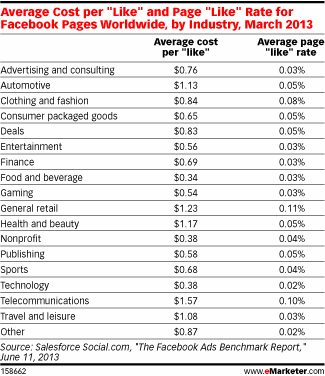
Global Facebook Cost Per Like By Industry, March 2013 [TABLE]
General retail and telecommunications had the most success generating page “likes,” at a rate of 0.11% and 0.10%, respectively.
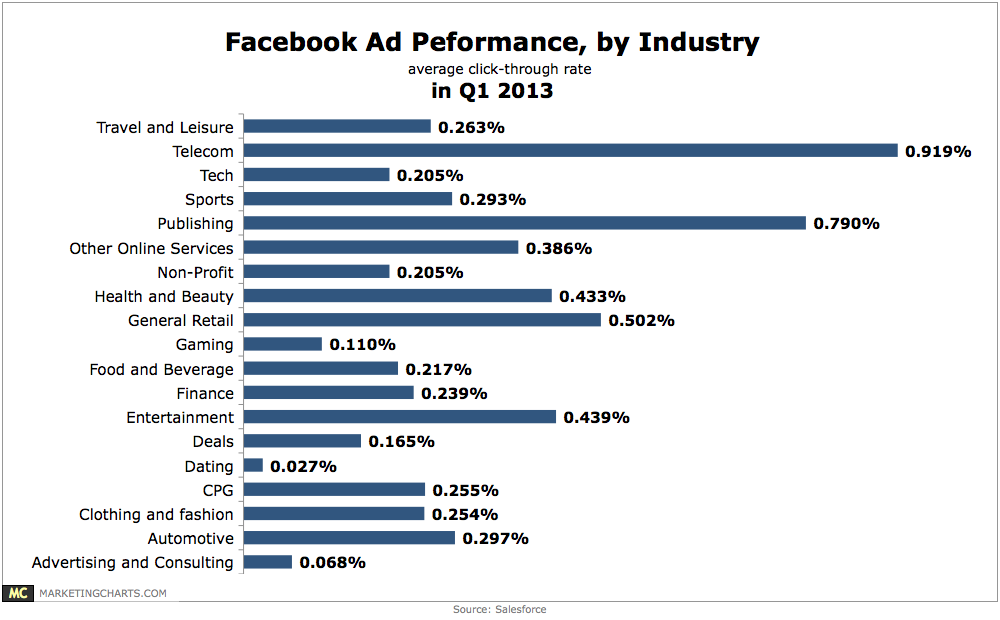
Read MoreFacebook Ad Performance By Industry, Q1 2013 [CHART]
Telecom (0.919%) and publishing (0.79%) brands are leading the charge in Facebook click-through rates.
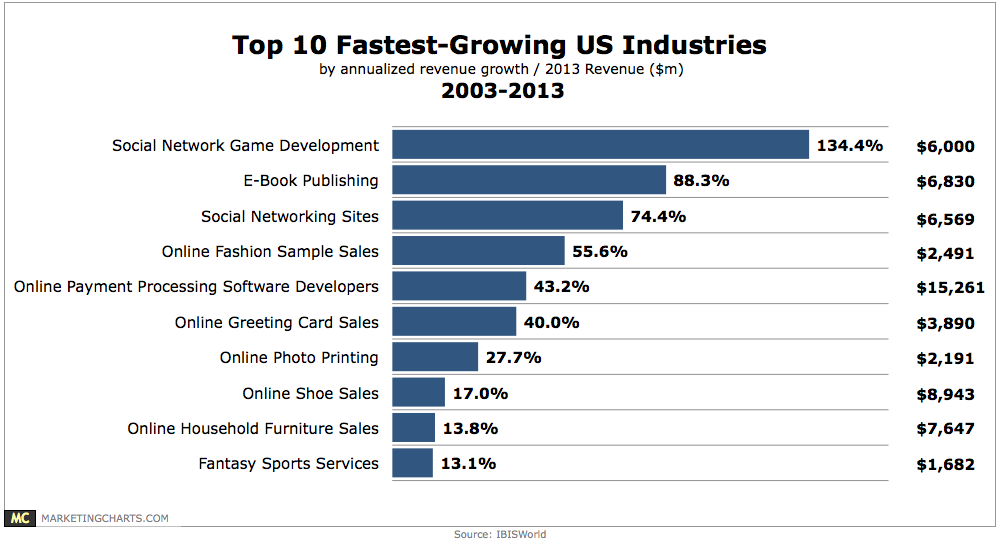
Read MoreTop 10 Fastest-Growing US Industries, 2003-2013 [CHART]
The IBISWorld study examines annualized revenue growth over the past 10 years, coming to the conclusion that the fastest-growing US industries all share a common trait: they’re all online-based.
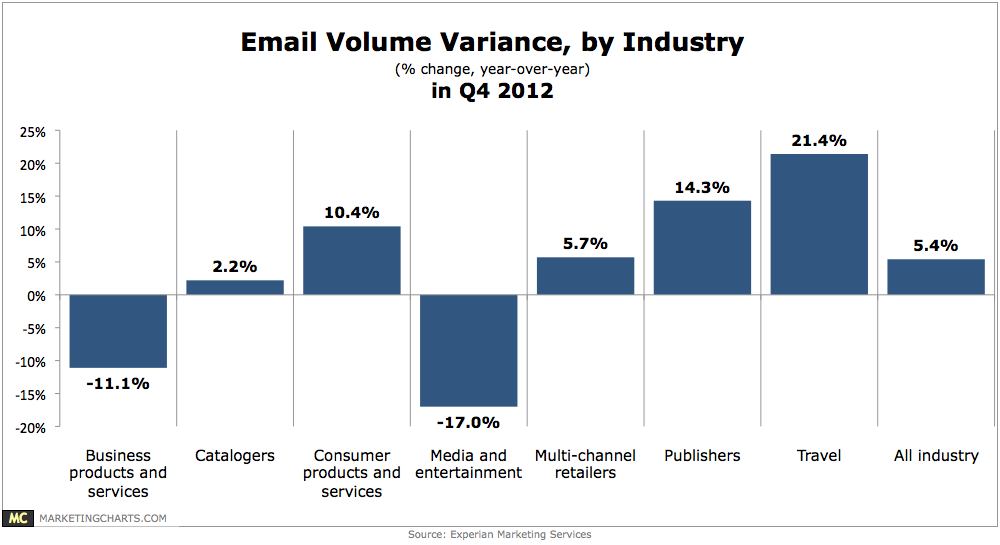
Read MoreEmail Volume Variance By Industry, Q4 2012 [CHART]
Email volume rose 5.4% year-over-year in Q4.
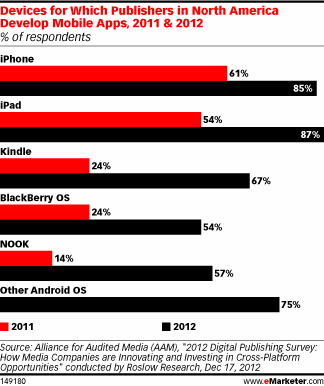
Read MoreNorth American Publishers' Mobile Apps By Device, 2011 & 2012 [CHART]
The iPhone and iPad were the No. 1 devices for which publishers developed mobile apps. Mobile apps are important to media companies across all devices, however.
Read MoreEmail Volume Variance By Industry [CHART]
Email volume rose 10.1% year-over-year in Q2, though the quarter-over-quarter rise was more muted, at 2%.
Read MoreMobile Pageviews By Industry Category [CHART]
Mobile consumers viewed an average of 3.8 pages per site visited.
Read MoreEmail Unsubscribe Rates By Industry [TABLE]
Travel & leisure registered a particularly high unsubscribe rate, which rose to 6.77% in the bottom quartile. Computer software was again a top performer, though nonprofits recorded the lowest average.
Read MoreEmail Click-Through Rates By Industry [TABLE]
The average CTR across the regions was 5.2%, though Canada achieved just 3.8% compared with 5.4% in the US and 5.1% in EMEA.
Read MoreUnique Email Open Rates By Industry [TABLE]
Consumers were more receptive to email messages issued by the computer software industry, with the top performers in that industry achieving open rates of 55.0%.
Read More