Posts Tagged ‘Nonprofit Marketing’
US Nonprofit Site Donation Conversion Rates By Sector, 2013 [CHART]
16% increase in monthly site traffic for the US nonprofits studied led to a site donation conversion rate of 0.69%, upping the average visit value to 60 cents.
Read MoreShare Of Online Nonprofit Donations By Sector & Source, 2013 [CHART]
Email open rates, clickthrough rates, page completion rates—and as a result, email response rates—were all down for US nonprofits last year.
Read MoreForm Conversion Rates By Type, June 2014 [CHART]
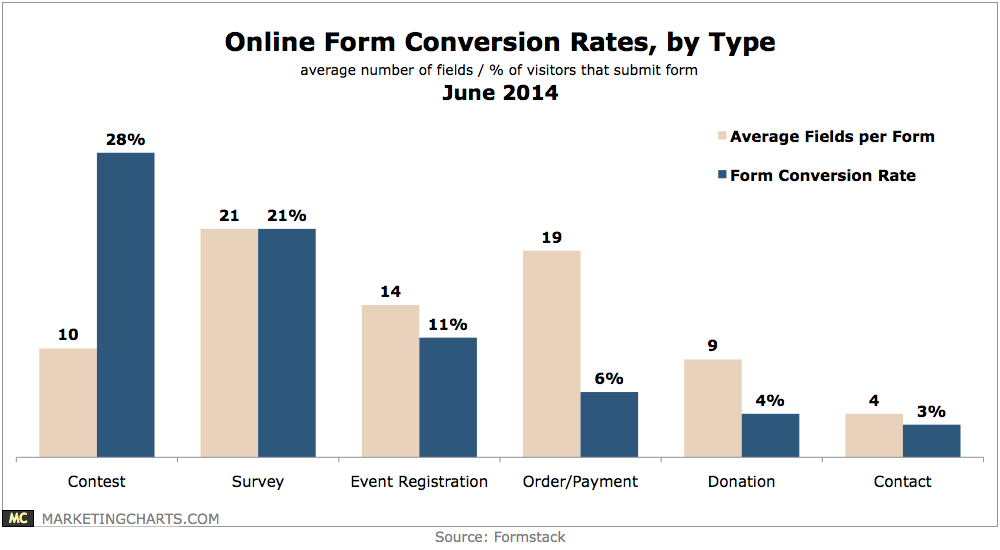
The average conversion rate for forms in the US is 7%.
Read MoreSocial Channels Top Charities & Non-Profits Use, June 2014 [CHART]
Social media use is almost ubiquitous among top charities and non-profits, with 98% using at least one platform.
Read MoreAffluents Expected Spending Changes, March 2014 [TABLE]
US affluent spending hadn’t completely rebounded: 45.0% of respondents were still being cautious with major purchases, saying they wouldn’t spend on any of the options listed.
Read MoreMultichannel Marketing's Effect On Select Business Areas, March 2014 [CHART]
Fully 82% of US small businesses and nonprofits had begun using multichannel marketing programs.
Read MoreTop Marketing Concerns Among US Small Businesses & Nonprofits, March 2014 [CHART]
Making marketing dollars go further was the No. 1 marketing concern among US small businesses and nonprofits, cited by 59% of respondents.
Read MoreTop Marketing Concerns For Small Businesses & Nonprofits, April 2014 [CHART]

Their top-stated concerns are making their marketing dollars go further and selecting the best campaigns to run.
Read MoreTop Industries By Branded Video Views Worldwide, 2013 [TABLE]
The consumer packaged goods industry saw the most video ad views, with over 2.22 billion.
Read MoreMost Common Purchases On Mobile Phones, Tablets & PCs, March 2014 [TABLE]
The vast majority of mobile phone and tablet owners have purchased products and services on their devices.
Read More