
Posts Tagged ‘News Marketing’
Products Researched & Purchased On A Tablet, March 2012 [TABLE]
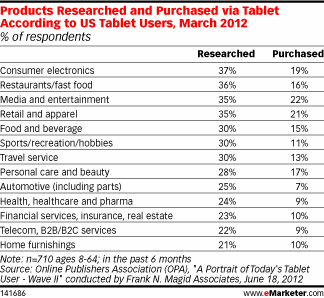
A survey from the Online Publishers Association compared product research with product purchase by category among tablet users in March 2013.
Read MorePreferred Television Genres By Viewing Device, June 2013 [CHART]
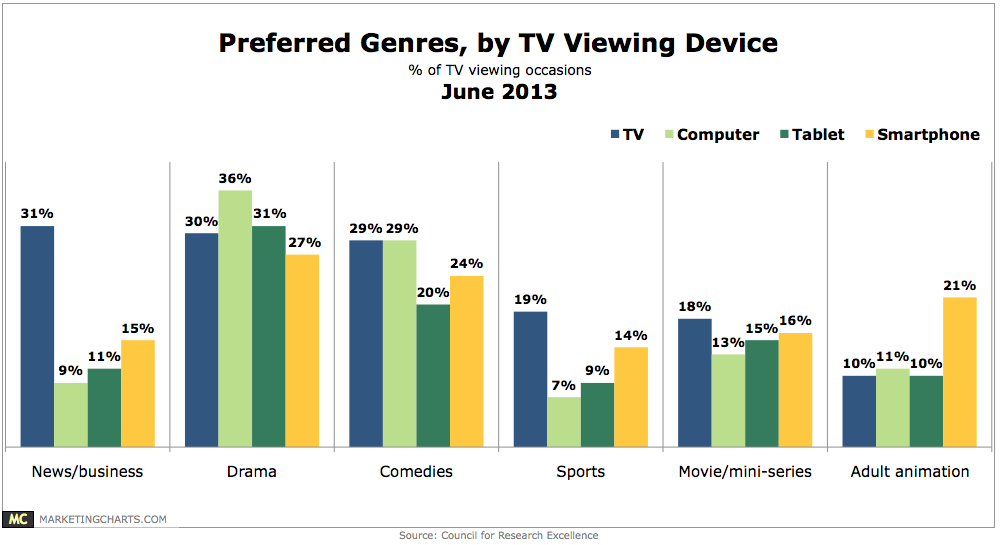
On the traditional TV, news and business (31%) got the edge on drama (30%) and comedies (29%) as the top genres by percentage of viewing occasions.
Read MoreSenior Execs' Use Of Mobile, April 2013 [CHART]
Tablet adoption in particular has jumped, doubling in a year to 6 in 10 respondents, with use growing across all age groups.
Read MoreTime Spent Online By Activity, 2011 & 2012 [TABLE]
On the desktop internet, activity was much more heavily weighted toward social networking, which accounted for 27% of time spent online.
Read MoreTime Spent On Mobile Device Online By Activity, Q1 2013 [TABLE]
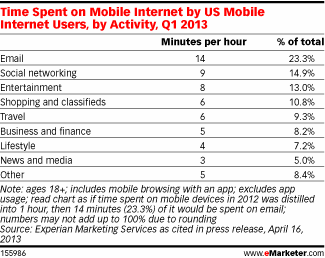
US mobile internet users spent the greatest percentage of their mobile web time using email, a 23% share of time spent vs. only 5% of time spent on desktop.
Read MoreShare Of Americans' Time Online By Category, 2011 vs 2012 [CHART]
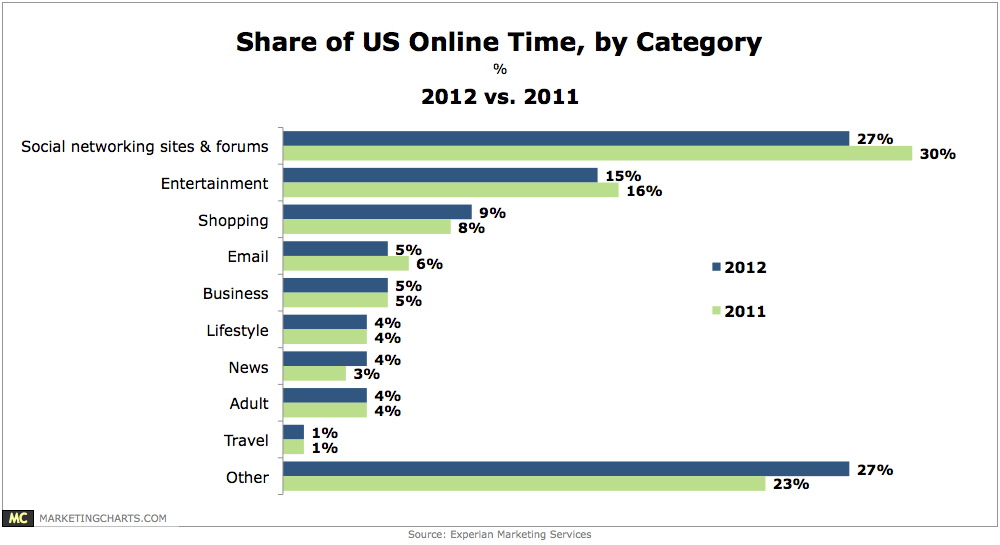
27% of Americans’ time spent online last year was spent accessing social networking sites and forums.
Read MoreTime Spent On iOS & Android Devices By Activity, April 2013 [CHART]
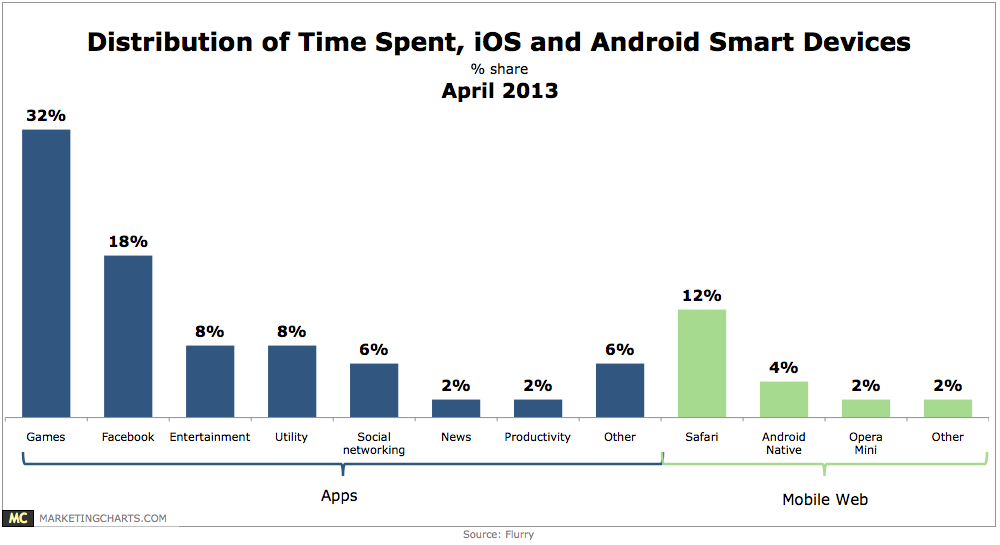
Android and iOS smart phone and tablet users spend an average of 2 hours and 38 minutes per day on their devices.
Read MoreAmericans' Daily Media Consumption, 2012 vs 2013 [CHART]
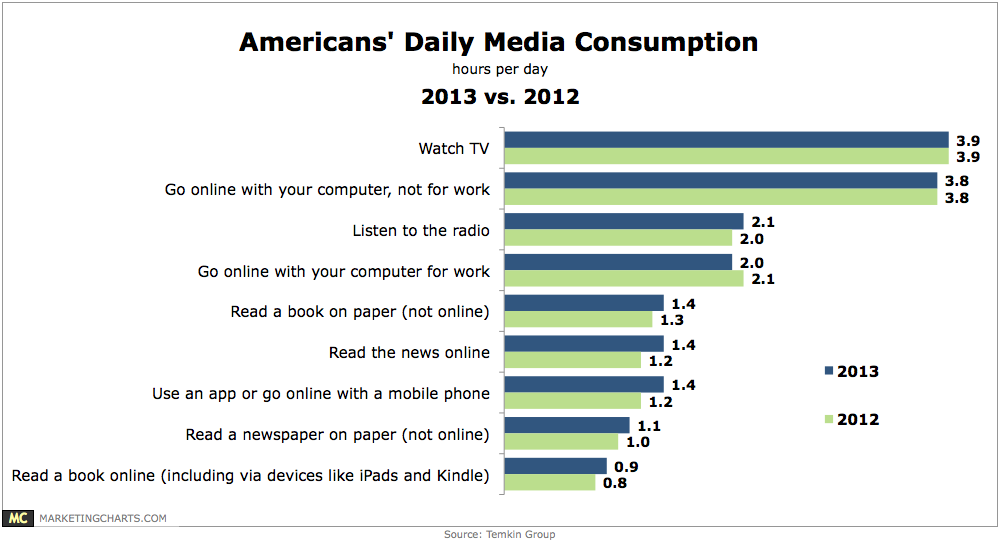
Americans are holding steady in terms of their TV consumption and non-work-related internet use, but are spending more time with other activities such as reading books and accessing the internet via a mobile device.
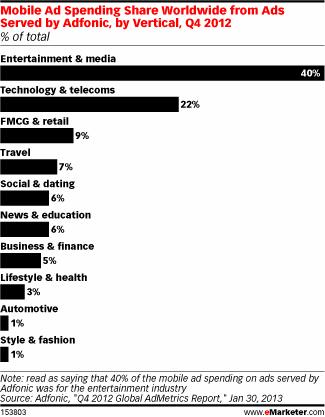
Read MoreGlobal Mobile Ad Spending Share By Vertical, Q4 2012 [CHART]
The worst performers on tablets vs. smart phones were the fast-moving consumer goods and retail industry, along with the social and dating category.
Read MoreTablet Ad Click-Through Rate Uplift By Industry, December 2012 [CHART]
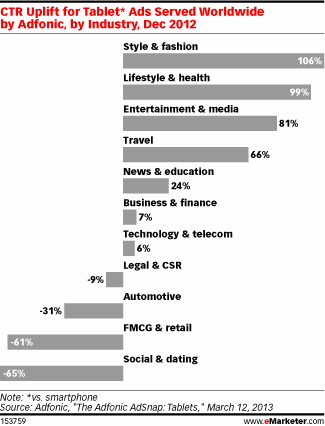
Click-through rates for entertainment and media, as well as the travel category rose by 81% and 66%, respectively.
Read More