Posts Tagged ‘Mobile Social’
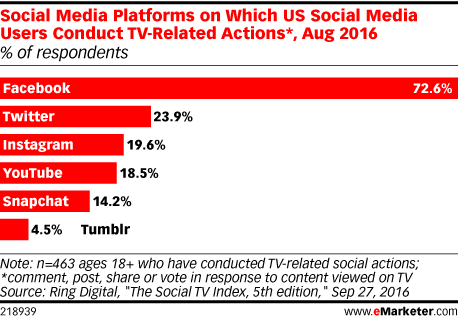
Social TV Behavior By Channel [CHART]
A majority of US social media users who comment, post, share or vote in response to content they view on TV do so on Facebook.
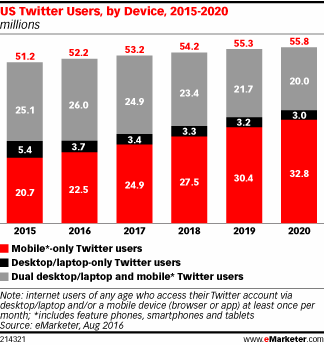
Read MoreTwitter Users By Device, 2015-2020 [CHART]
More than 52 million people in the US will use Twitter on a monthly basis.
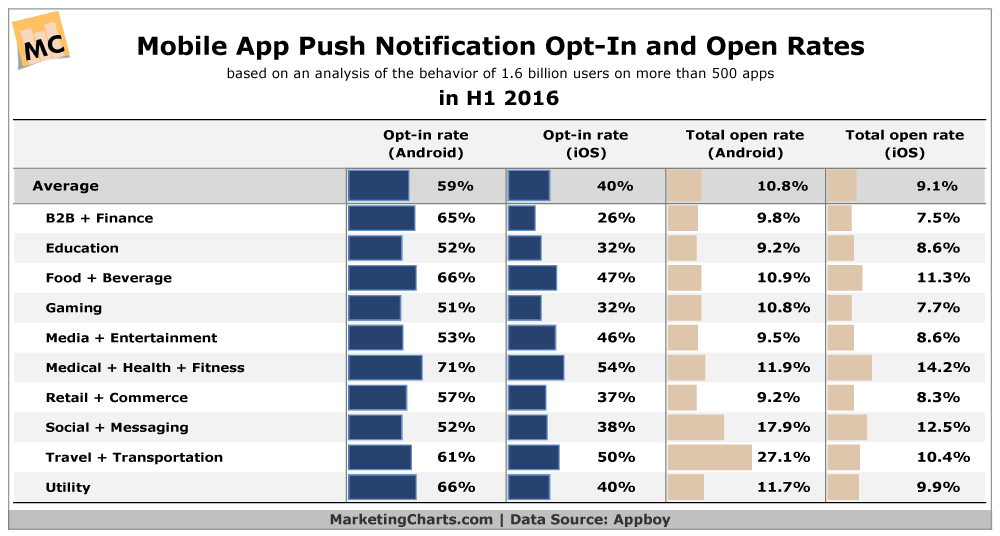
Read MoreMobile Notification Benchmarks [CHART]
A recent study from Appboy takes a look at various app categories, based on the behavior of 1.6 billion users on more than 500 apps in the first half of 2016.
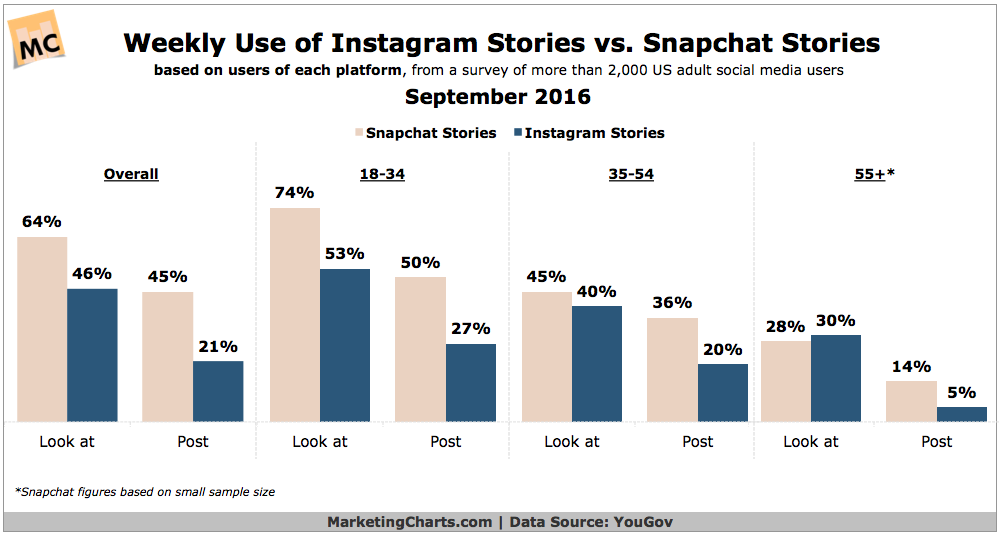
Read MoreInstagram Stories vs Snapchat Stories [CHART]
Snapchat users are more engaged with Snapchat Stories than Instagram users are with recently-launched Instagram Stories, and US adults who have used either would rather use Snapchat stories.
Read MoreTeen Internet Use By Platform [CHART]
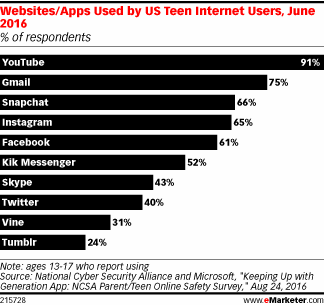
The National Cyber Security Alliance and Microsoft polled 804 US teen internet users ages 13 to 17 about their digital activities.
Read MoreAmericans' Daily Social Media Use By Device [CHART]
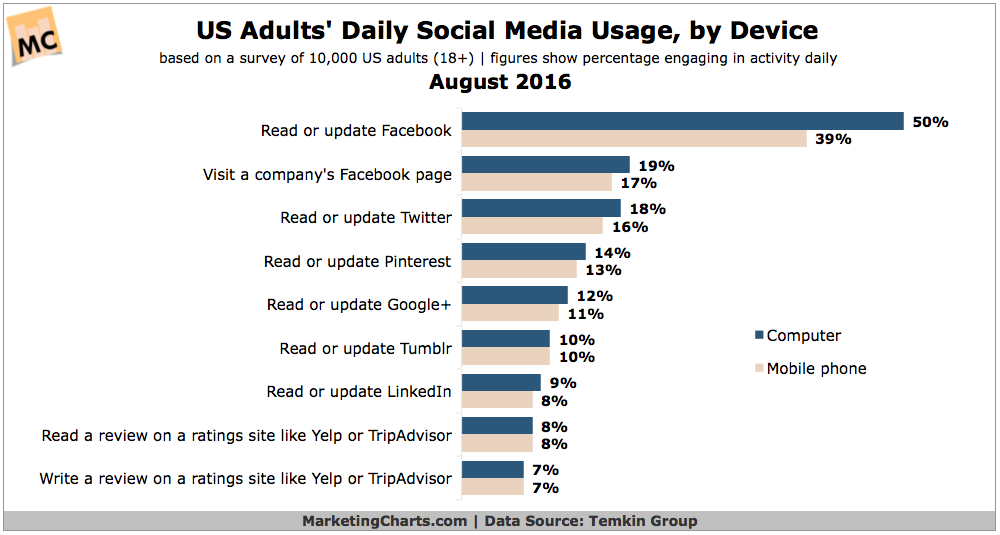
Some 19% of American adults visit a company’s Facebook page each day from a computer, and a similar proportion (17%) do so every day from their mobile phone.
Read MoreAmerican WhatsApp Users, 2014-2020 [CHART]
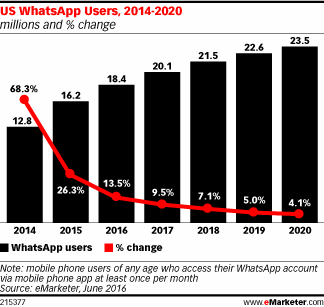
About 5.6 million more people have gotten on board with WhatsApp.
Read MoreDemographics of Messaging App Users
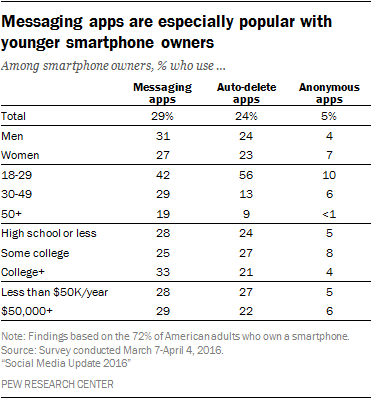
Some 56% of smartphone owners ages 18 to 29 use auto-delete apps, more than four times the share among those 30-49 (13%) and six times the share among those 50 or older (9%).
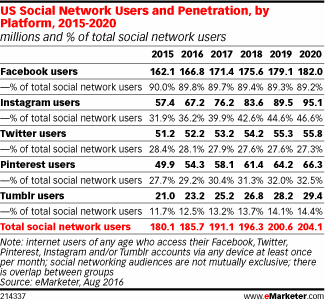
Read MoreSocial Network Users & Penetration By Plaftorm, 2015-2020 [TABLE]
By the end of 2016, 52.2 million people in the US will access their Twitter accounts at least once a month. That’s a 2.0% increase over last year.
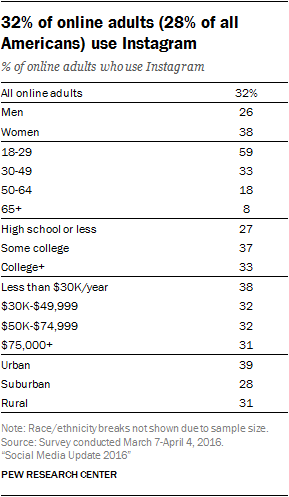
Read MoreDemographics Of Instagram Users [TABLE]
Around one-third of online adults (32%) report using Instagram – roughly the same share as in 2015, when 27% of online adults did so.
Read More