Posts Tagged ‘Men’
Instagram Statistics [INFOGRAPHIC]
This infographic from Make A Video Hub illustrates Instagram’s history and growth, demographics and usage statistics.
Read MoreDemographics Of Social Media Distrust [CHART]
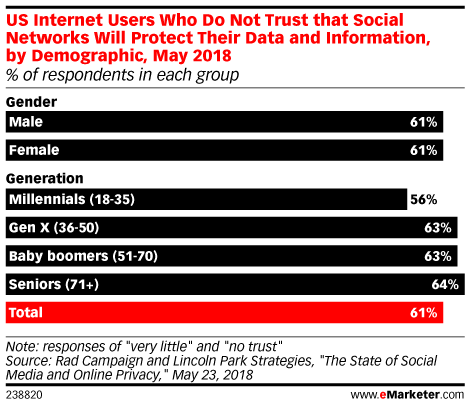
Most US internet users say they don’t trust social networks to protect their personal information. A May 2018 survey by Rad Campaign found that 61% of respondents had little to no trust in social networks. That compares with 53% in 2016, and 57% in 2014.
Read MoreOffline Americans By Demographic [CHART]
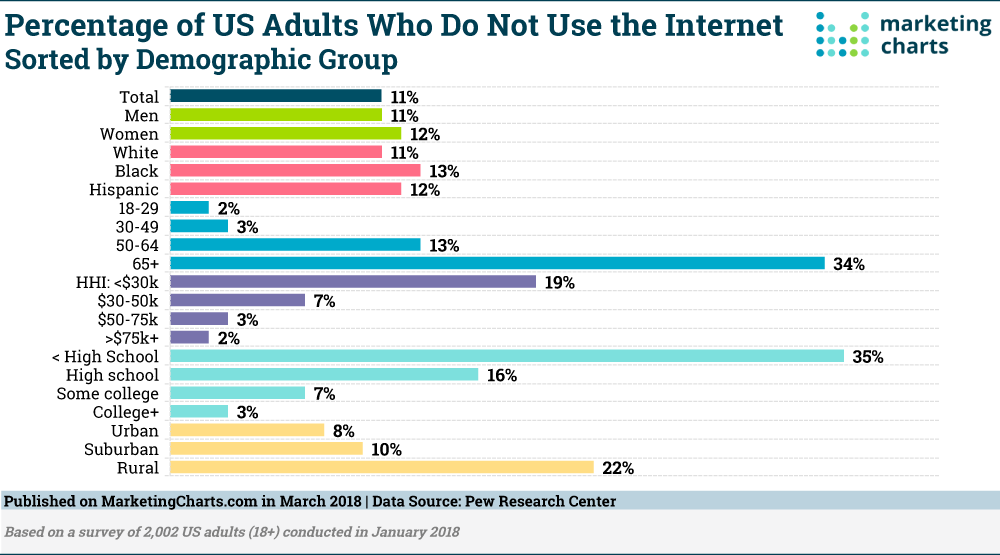
A declining yet substantial proportion of the US adult population does not use the internet. In fact, 11% of US adults do not go online, with that figure down from 15% in a previous analysis released 5 years ago.
Read MoreVideo Game Industry [INFOGRAPHIC]
This new infographic from Filmora illustrates the growth and potential of the video game industry.
Read MoreEmoji Users By Gender [CHART]
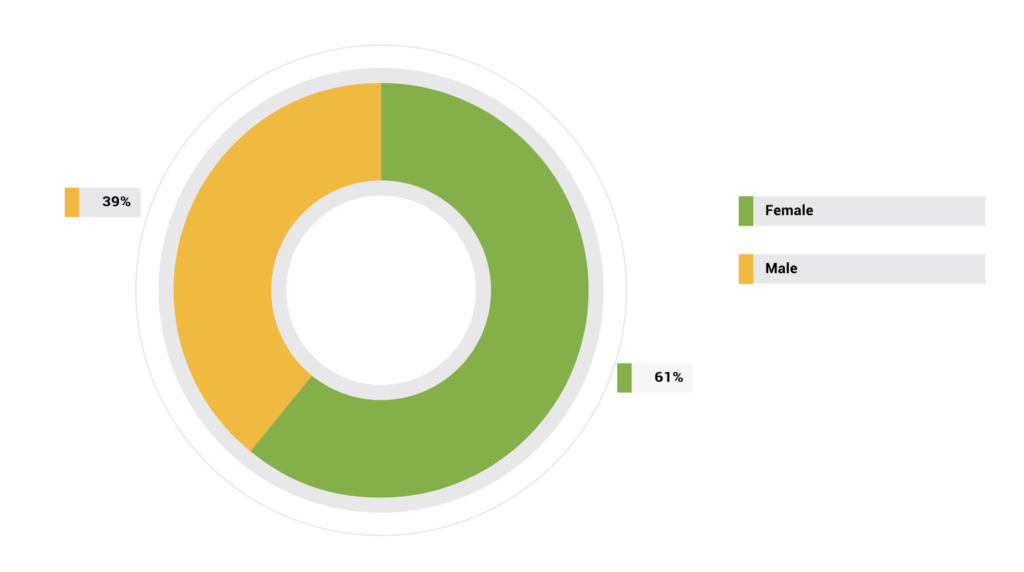
An analysis of 6 billion emojis used over the past two years shows women continue to use more emojis than men, negative emoji use spikes over night, and Virgin Atlantic sees more positive emojis in its mentions than American Airlines.
Read MoreMoms' Most-Watched Movie Genres On TV [CHART]
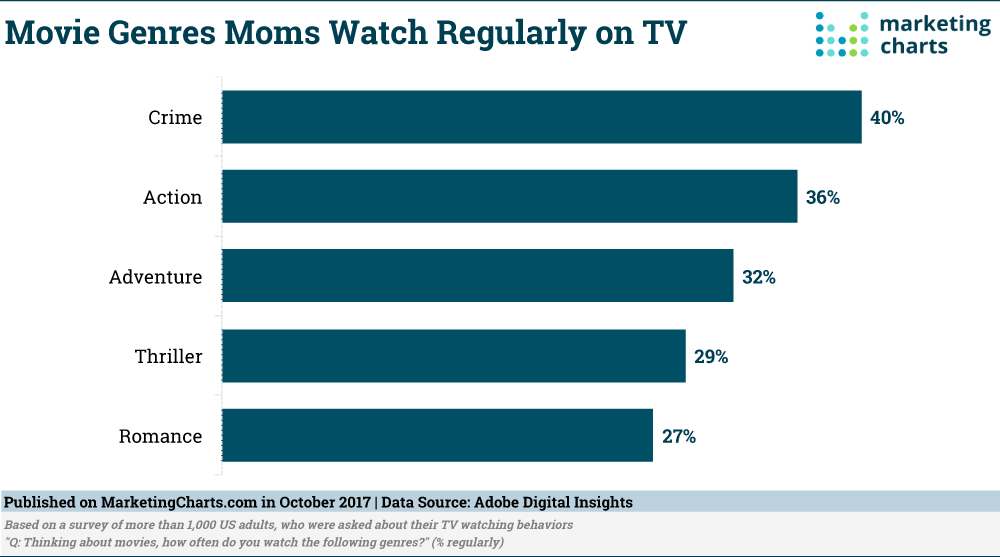
Moms love action and men watch romance. Surprised? A study from Adobe Digital Insights finds that some stale stereotypes simply don’t apply. Mothers watch Crime and Action movies more regularly than Romances, while many men often watch Musicals and Romance movies.
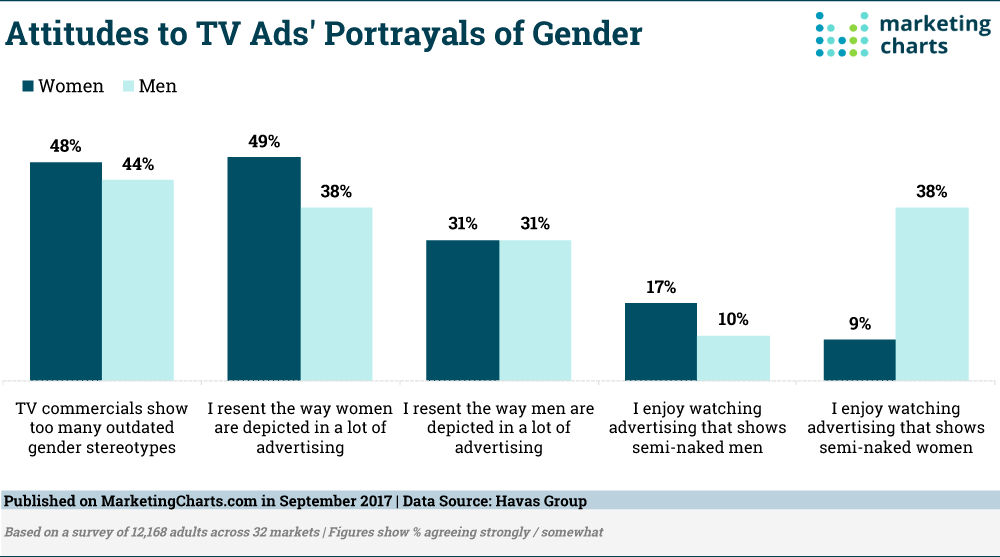
Read MoreAttitudes Toward Gender Stereotypes In TV Commercials [CHART]
Despite some progress, TV isn’t doing a good enough job of promoting inclusiveness and gender equality, according new studies from Havas Group and Univision. Almost half of women from various countries around the world agree that TV ads show too many outdated gender stereotypes.
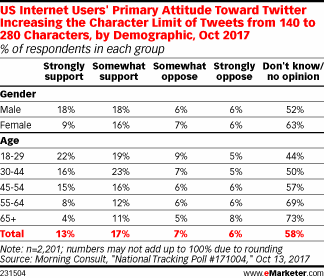
Read MoreAttitudes Toward Twitter's Increased Character Count [TABLE]
41% of respondents ages 18 to 29 having at least a somewhat positive reaction to the change, and just 14% expressing reservations.
Read MoreYouTube Statistics, 2017 [INFOGRAPHIC]
This infographic from filmora illustrates some amazing facts, figures and statistics about YouTube for 2017.
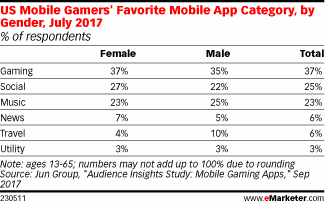
Read MoreGamers Favorite Mobile App Categories By Gender [TABLE]
Jun Group’s survey found that a slightly higher percentage of females named games as their favorite type of mobile app than did males.
Read More
