Posts Tagged ‘iOS’
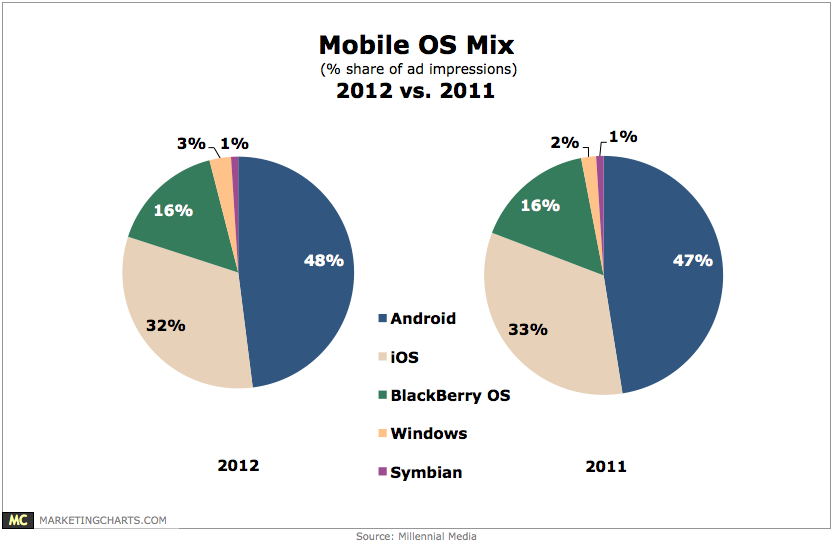
Mobile Operating System Market Share, 2011 vs 2012 [CHART]
With 75% share of total ad impressions, the smart phone share grew by 7% points from 2011.
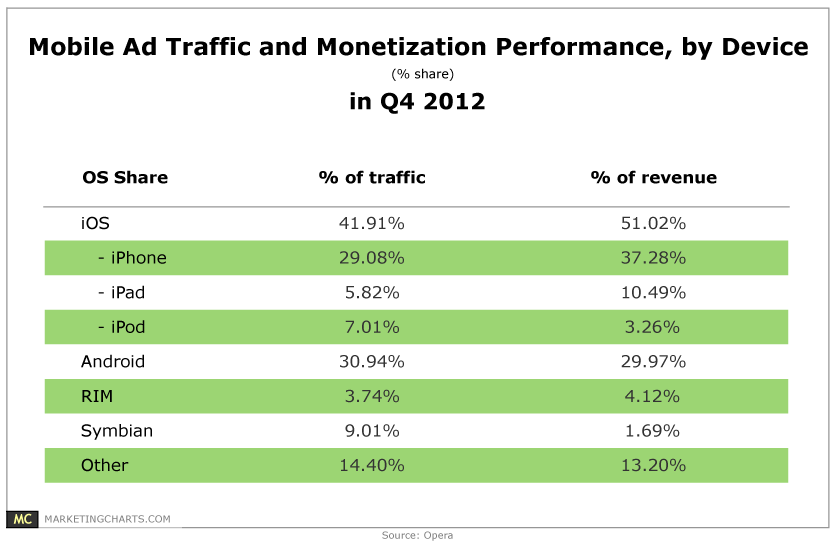
Read MoreMobile Ad Traffic Monetization By Device, Q4 2012 [TABLE]
Among mobile platforms, Apple’s iOS leads in monetization performance on the Opera Advertising mobile platform.
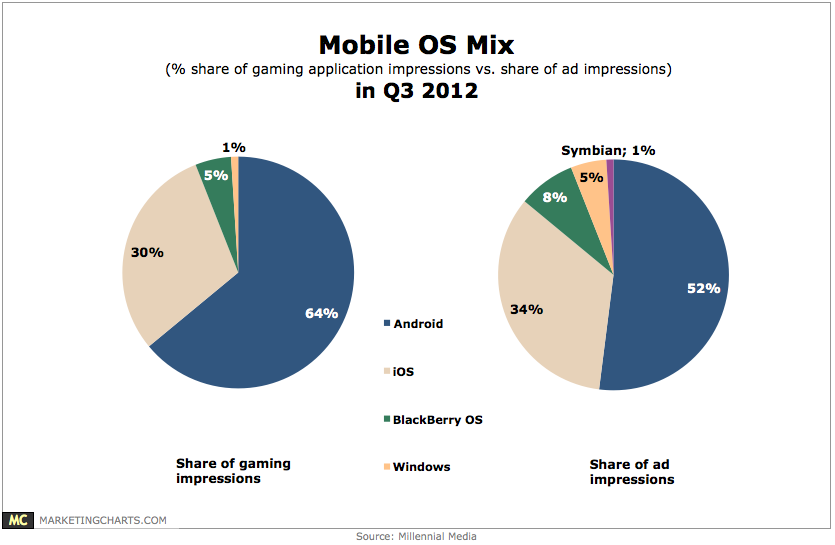
Read MoreMobile OS Market Share, Q3 2012 [CHART]
64% of mobile game impressions came from devices running the Android OS in Q3, while 30% came from iOS.
Read MoreGlobal Facebook Ad Spending By Device & OS, December 2012 [CHART]
Breaking down how that mobile spending was distributed by device, the company found, unsurprisingly, that on smartphones, Android received the bulk of Facebook ad spend, at 71%, while on tablets, nearly all Facebook mobile advertising revenues went to iOS devices.
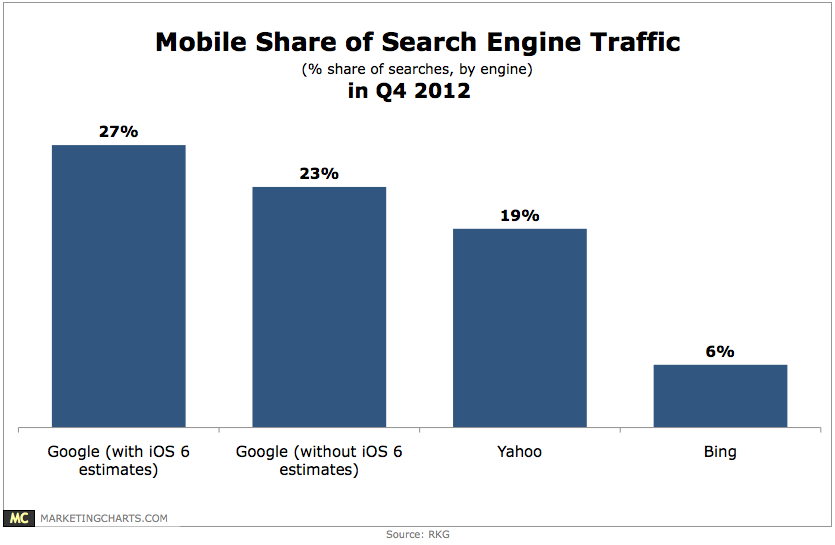
Read MoreMobile Search Engine Traffic Market Share, Q4 2012 [CHART]
Mobile activity on Google far outpaced Yahoo and Bing.
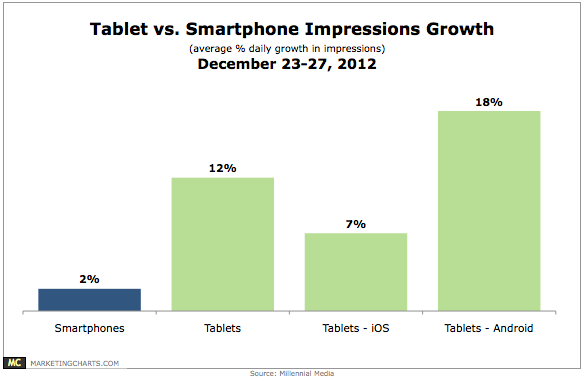
Read MoreTablet vs. Smart Phone Impressions, December 23-27, 2012 [CHART]
Recent research from Flurry has revealed the flood of tablet activations on Christmas Day, and new data from Millennial Media supports the idea that tablets were a preferred gift item this past holiday season.
Read MoreTop iPhone Apps Of 2012 [CHART]
The iPhone apps on the list that saw the biggest year-over-year growth were Facebook Messenger (+554%) and Instagram (+197%), also owned by Facebook.
Read MoreFacebook Ad Spending By Mobile Devices, January 2013 [CHART]
Mobile devices (phones and tablets) now account for 20.3% of overall Facebook ad spending.
Read MoreMobile Platform Development Preferences, Q4 2012 [CHART]
About 63% of mobile developers are very interested in using HTML5 to build their apps.
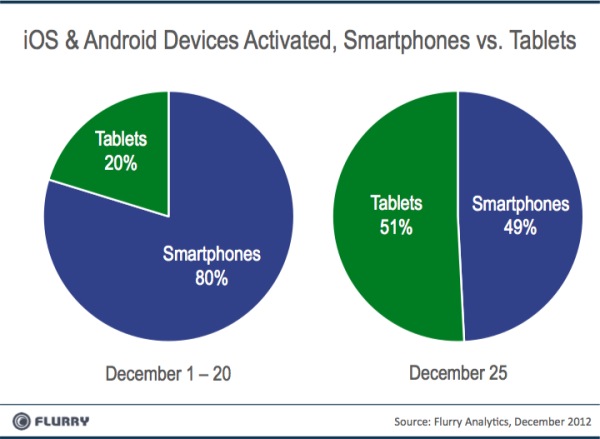
Read MoreChristmas Mobile Activations [CHART]
Christmas Day turned out to be a huge boost to the mobile device market.
Read More