Posts Tagged ‘Email Benchmarks’
Mobile Email Marketing Benchmarks [CHART]
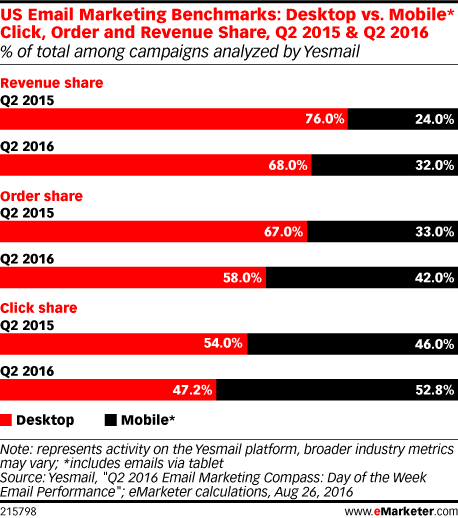
Compared to a year earlier, mobile’s role was more prominent across several metrics.
Read MoreEmail Conversion Rates By Day Of The Week [CHART]
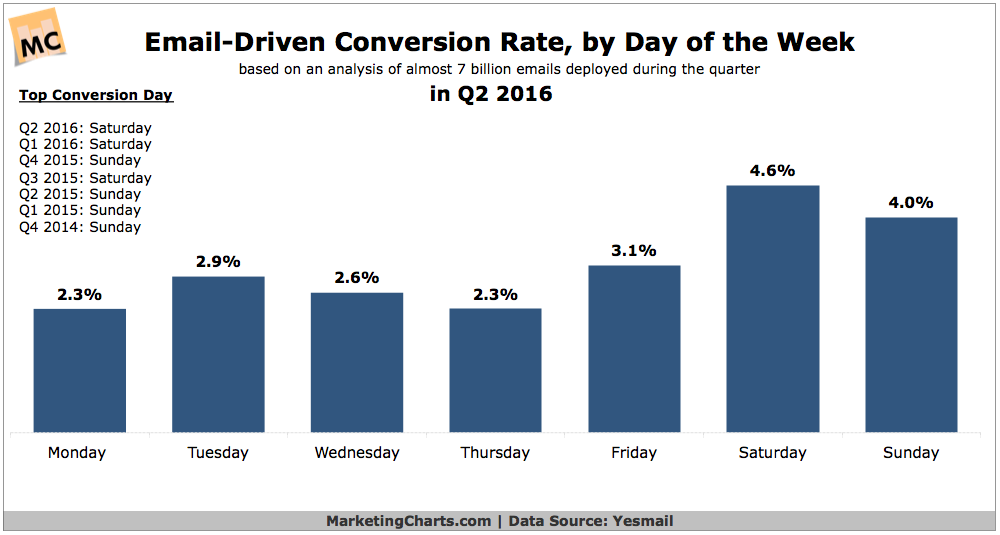
For email marketers, mid-week may provide the best engagement rates, but the weekends are when conversions are highest.
Read MoreEmail Reading, Glancing & Scanning By Industry [CHART]
![Email Reading, Glancing & Scanning by Industry [CHART]](https://e-strategy.com/wp-content/uploads/2016/11/Email-Reading-Glancing-Scanning-By-Industry.png)
A majority (53%) of emails are read, meaning that the recipient (presumably) looks at the message for at least 8 seconds.
Read MoreEmail Opens By Device, 2011-2016 [CHART]
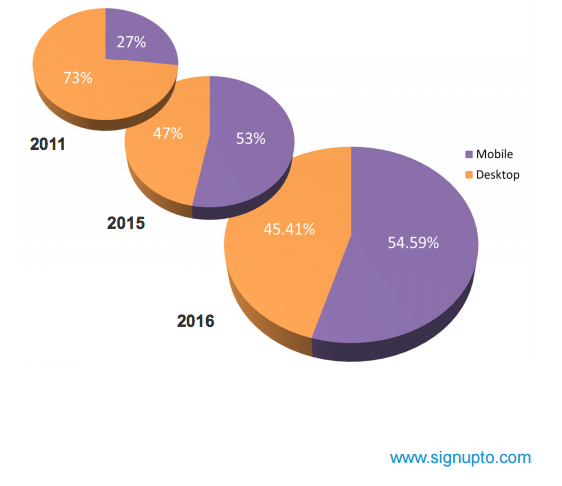
Research from Econsultancy’s 2016 email marketing benchmarks report demonstrates that people more frequently turning to their mobile devices to check email, growing from 27% in 2011 to 55% in 2016.
Read MoreGlobal Email Deliverability Rates By Industry, October 2015 [CHART]
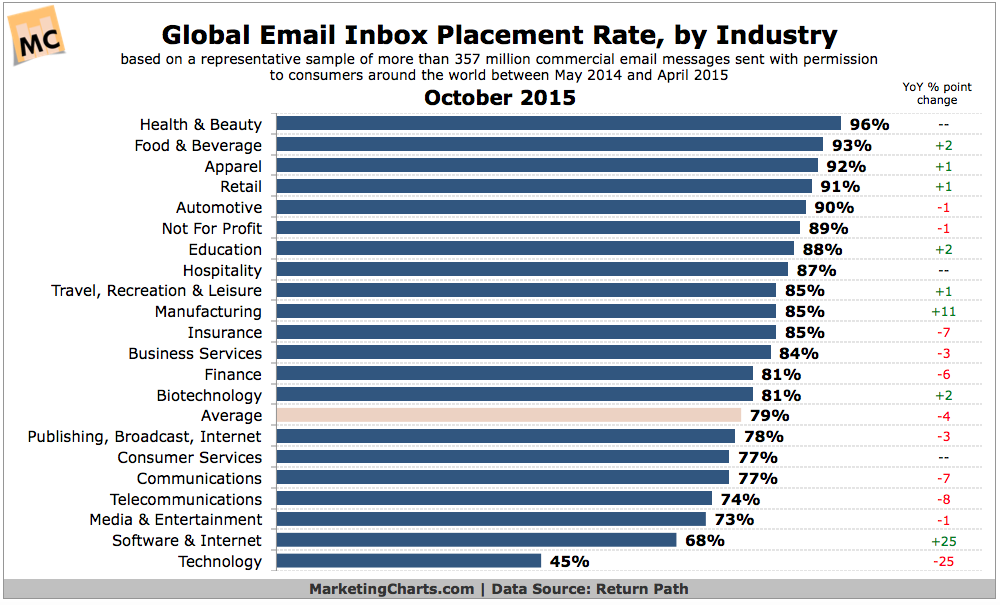
Some 21% of permission emails from legitimate senders around the world failed to reach the inbox during the year-long period from May 2014 to April 2015.
Read MoreMarketing Email Click Share By Industry, Q2 2015 [TABLE]
On average, 62% of clicks happened on the desktop—14 percentage points ahead of the desktop share of opens.
Read MoreMarketing Email Open Share By Industry, Q2 2015 [TABLE]
Overall, 48% of all marketing emails sent by Experian clients were opened on the desktop,
Read More2014 Retail Email Marketing Benchmarks [CHART]
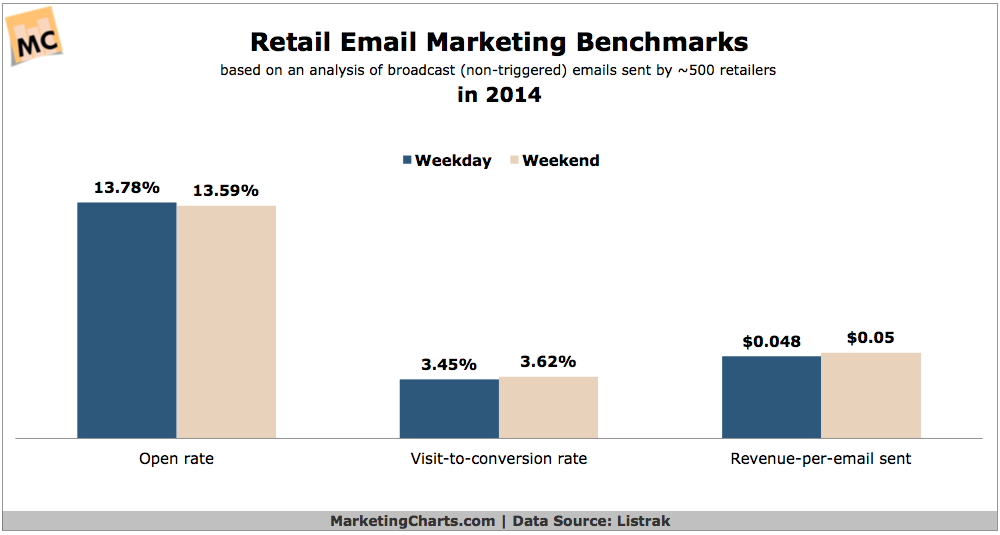
Retailers last year saw very little difference in email open and visit-to-conversion rates when sorting by weekday and weekend deployments.
Read MoreBenchmarks: Global Email Inbox Placement Rates By Industry, September 2014 [CHART]
Some 17% of permissioned emails from legitimate senders around the world failed to reach the inbox during the year-long period from May 2013 to April 2014.
Read MoreShare Of Email Campaigns Sent By Day Of The Week, January 2014 [CHART]
The majority of marketers opt to send emails during the week.
Read More