Posts Tagged ‘Click-Through Rates’
Facebook Ad Performance By Industry, Q1 2013 [CHART]
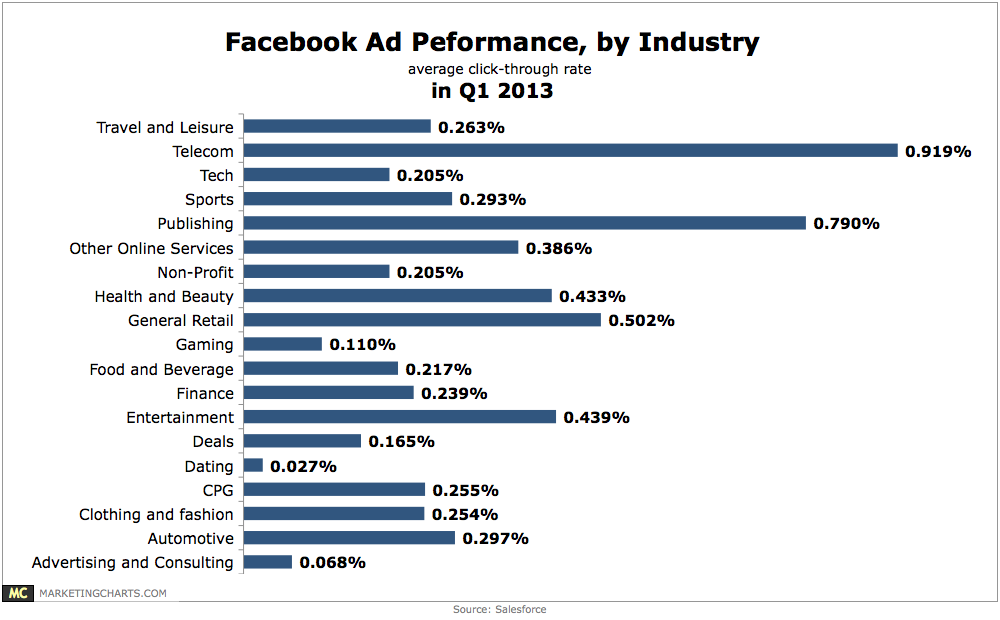
Telecom (0.919%) and publishing (0.79%) brands are leading the charge in Facebook click-through rates.
Read MoreGlobal Search Advertising Trends, Q1 2013 [CHART]
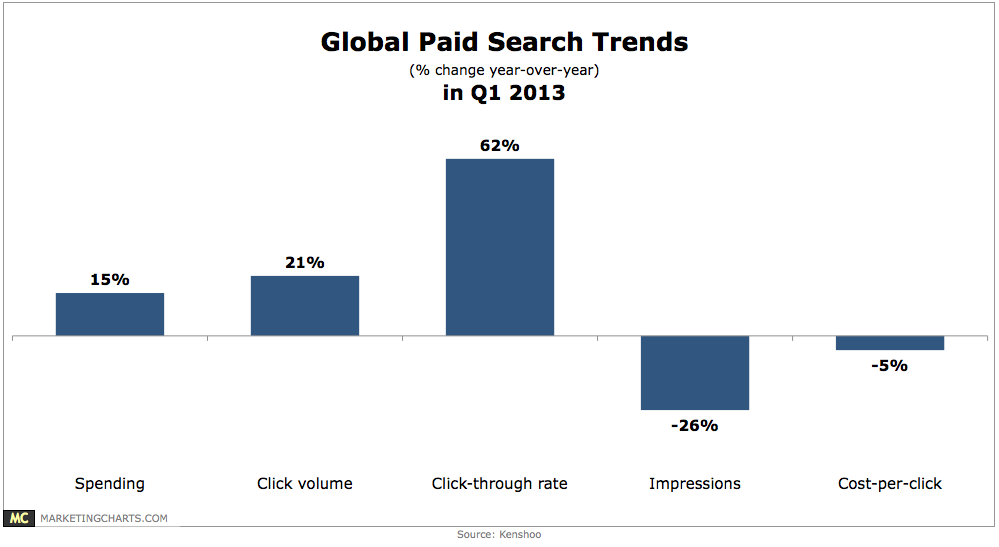
On a global basis, paid search click volume (+21%) and click-through rates (+62%) each saw strong growth, with spending up 15%.
Read MoreMonthly Average CTR For Q1 2013 By Mobile Device [CHART]

Advertisers devoted roughly three-quarters of their budgets to iOS devices during Q1 2013.
Read MoreEmail Marketing Benchmarks, 2012 [CHART]
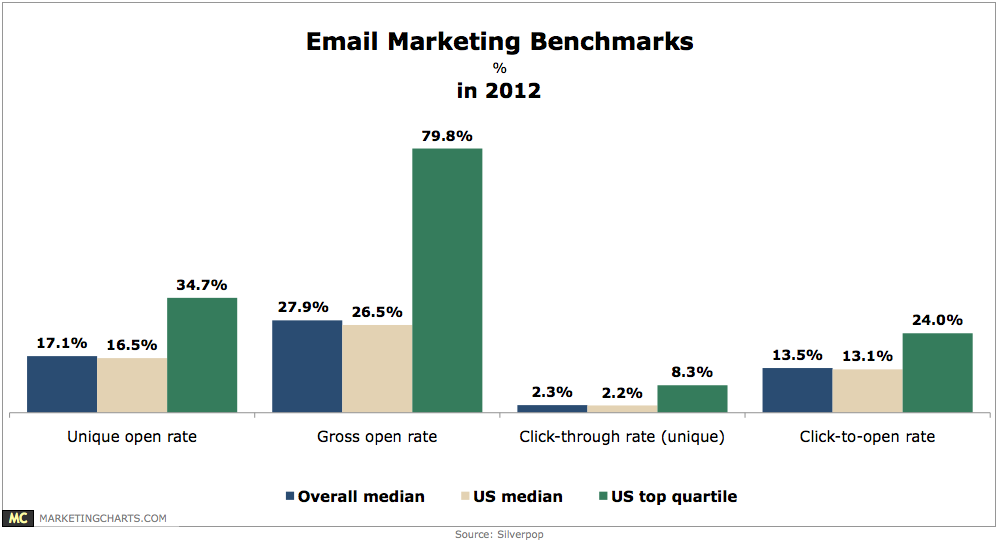
The median email CTR in the US stood at 2.2% last year, and the mean rate at 3.3%, but the top quartile of performers achieved an average rate of 8.3%.
Read MoreB2B Search Advertising Trends, Q1 2012-Q1 2013 [CHART]
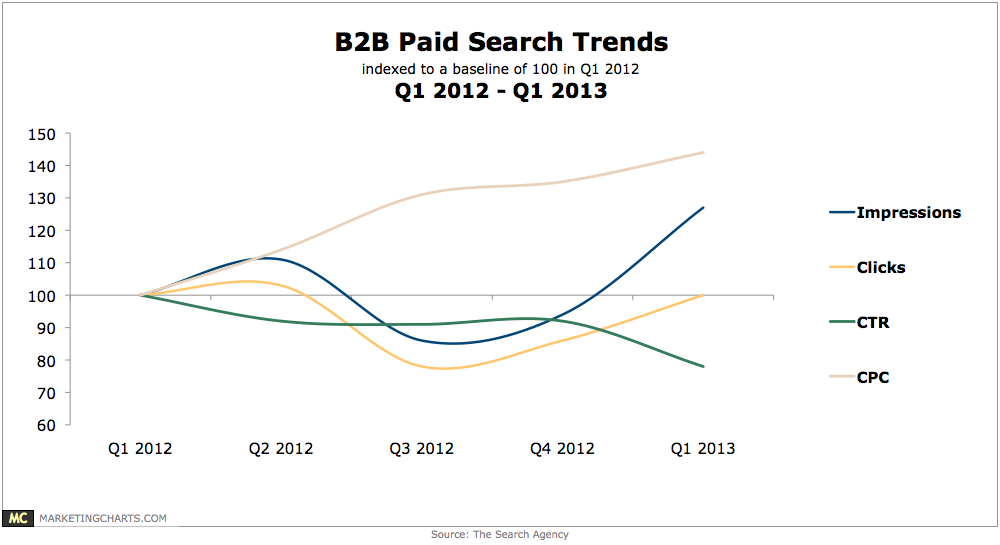
Looking at the B2B vertical, the study finds that impressions rose 27.2% year-over-year, while clicks stayed flat.
Read MoreEngagement & Click-Through Rates For Advanced Tablet Ads, October 2012 [TABLE]
At a clickthrough rate (CTR) of 8.7%, the banner to full-page ad’s clickthrough performance on tablets was more than four times greater than the static web banner.
Read MoreUS Search Advertising Click-Through Rates By Industry, Q4 2011-Q4 2012 [TABLE]
Only 20% of new-car shoppers in the US buy the brand they first searched for, according to Google data.
Read MoreIn-Stream Video Ad Response Rates By Gender, 2012 [TABLE]
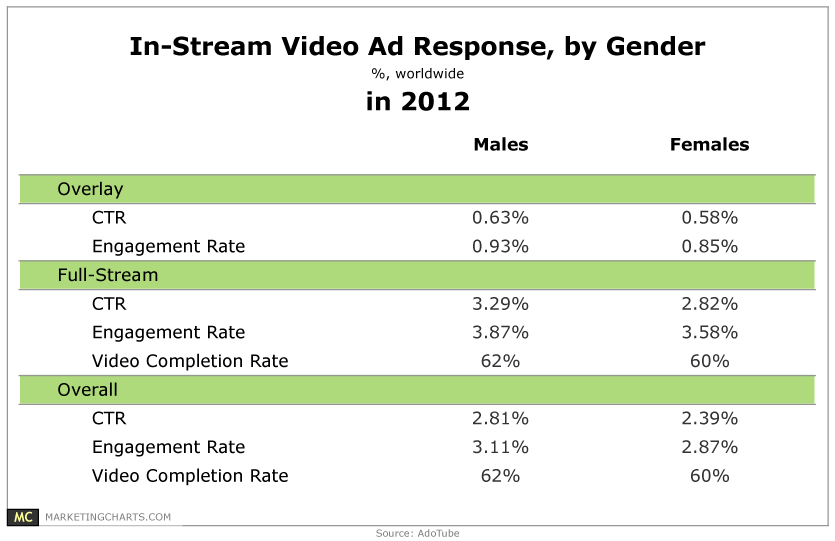
Men responded more to in-stream video ads than women, with a 17.6% higher click-through rate (CTR; 2.81% vs. 2.39%).
Read MoreContent Sharing Trends, April 2013 [TABLE]
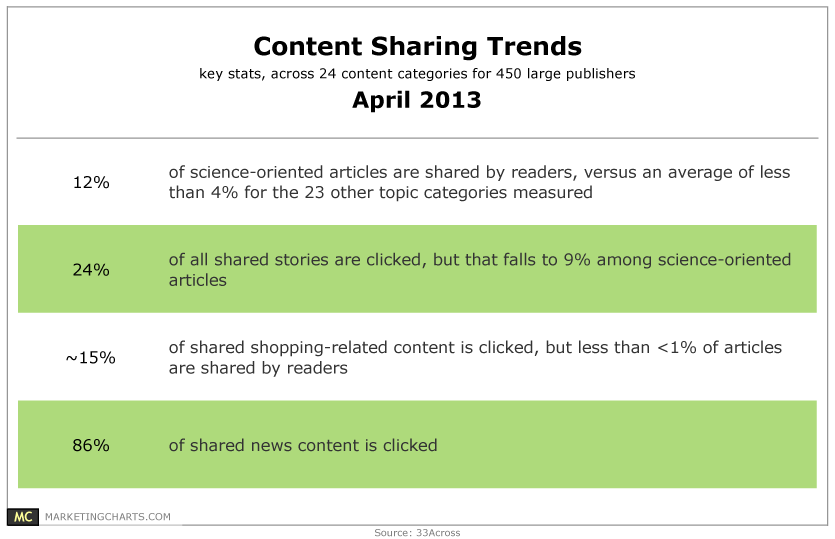
The types of content that people share may be driven more by ego than anything else.
Read MoreNorth American Email Marketing Metrics, Q4 2011 & Q4 2012 [TABLE]
Unique open rates increased from 14.4% in Q4 2011 to 16.3% in Q4 2012, while click-through rates, transaction rates, and revenue per email all held relatively steady.
Read More