Posts Tagged ‘Cable Television’
Americans' Small-Ticket Budget Cutbacks, November 2012 vs December 2013 [CHART]
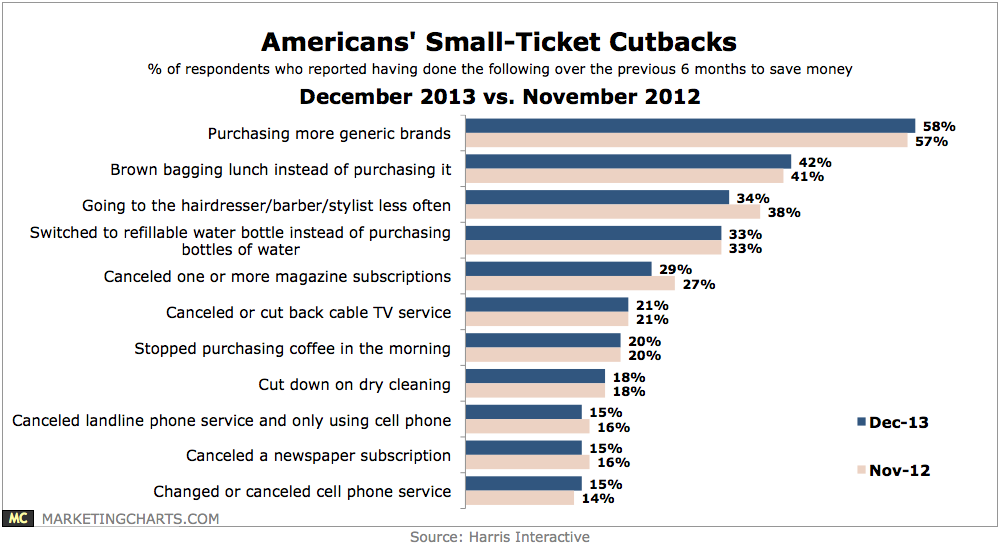
Americans ended 2013 slightly less likely to have been cutting back on small-ticket items to save money than they had been earlier on in the year.
Read MoreTV Everywhere Users & Pay-TV Satisfaction, January 2014 [CHART]
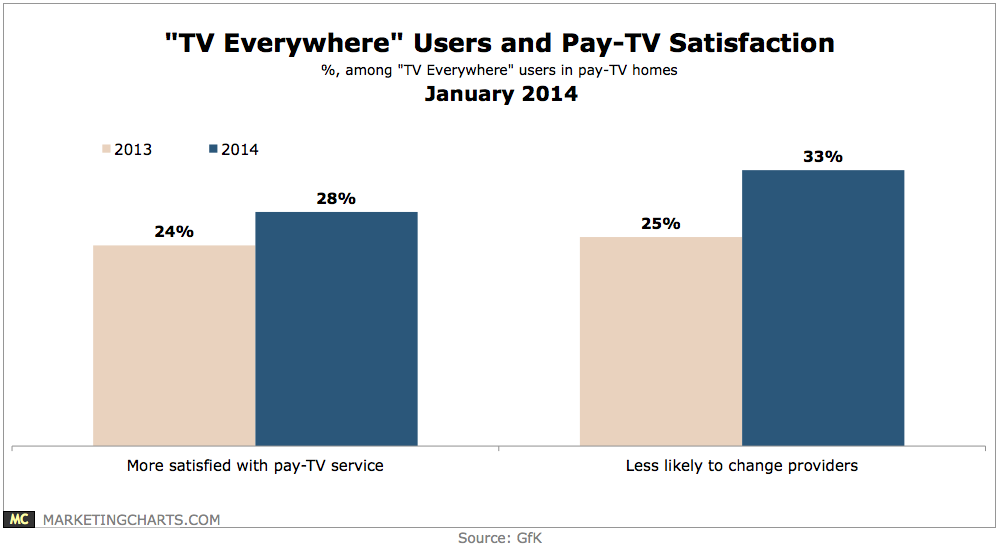
28% of TVE users feel more satisfied with their pay-TV service (up from 24% last year).
Read MoreCursing Customers By Industry [CHART]

Satellite TV providers’ customer service agents get cursed at the most by angry clients, according to a study by Marchex.
Read MorePay TV Subscription & Cord-Cutting, Q1 vs Q3 2013 [CHART]
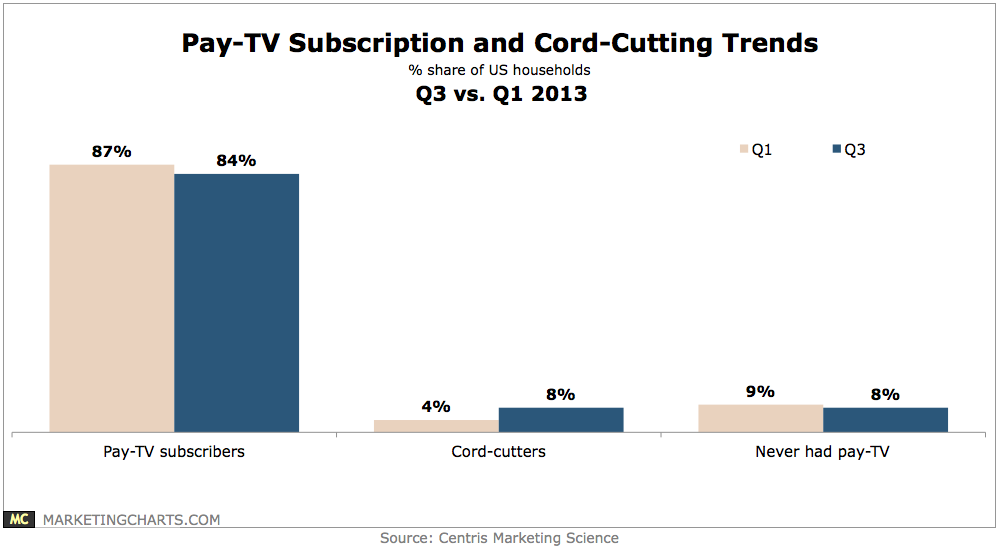
Centris indicates that 8% of US households reported having eliminated their pay-TV subscriptions in Q3 2013, double the percentage from the Q1 survey (4%).
Read MoreSMBs' Perceived ROI Of Traditional Media Advertising, January 2014 [CHART]
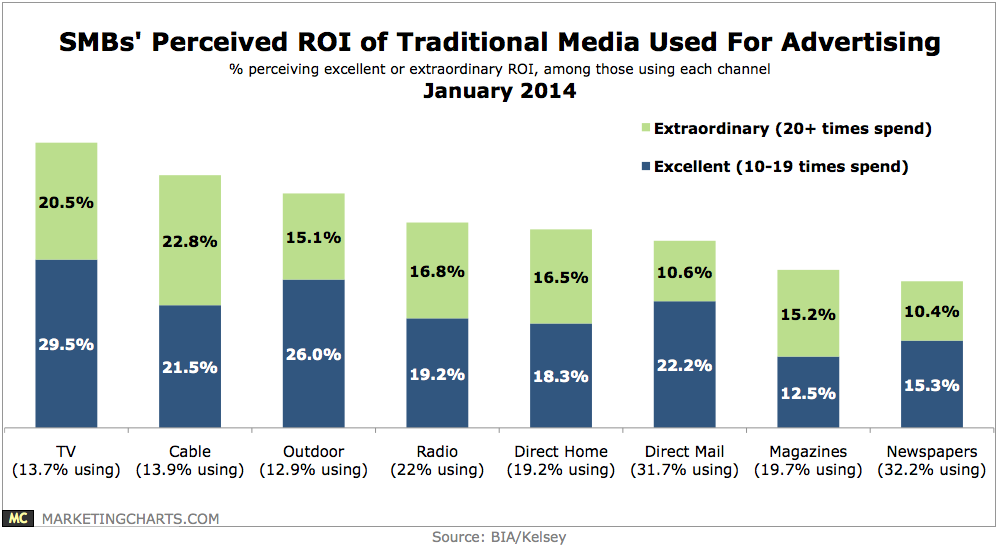
Newspapers (32.2%) and direct mail (31.7%) are the traditional media most commonly used by SMBs for advertising and promotion,
Read MoreTechnographic Generational Gap By Device, January 2014 [TABLE]
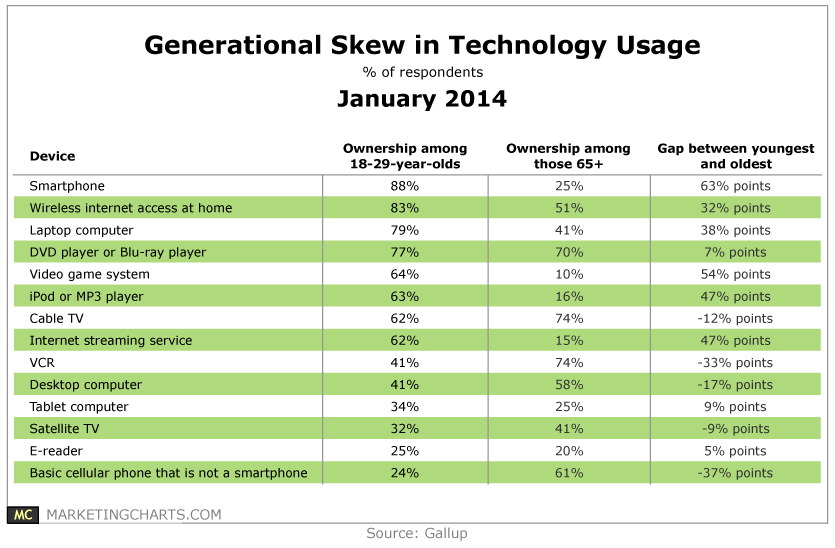
Gallup measured the penetration rates of 14 consumer electronic devices among 18-29-year-olds and those aged 65 and up.
Read MoreTV Viewing Via Cable Provider's App Or Website, January 2014 [CHART]
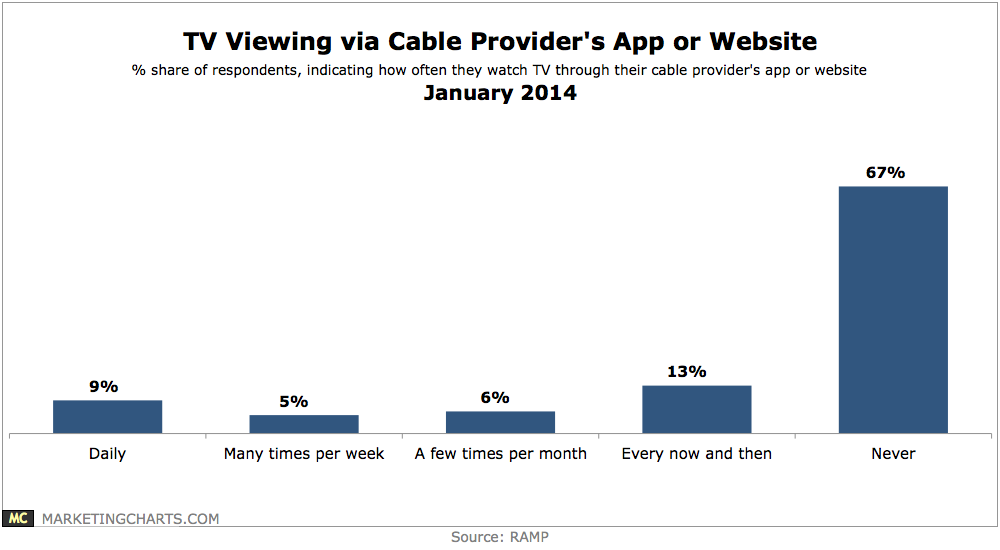
Some 80% of respondents are unaware of TV Everywhere.
Read MoreMulti-Channel Video Provider Subscription Trends, Q3 2012 vs Q3 2013 [CHART]
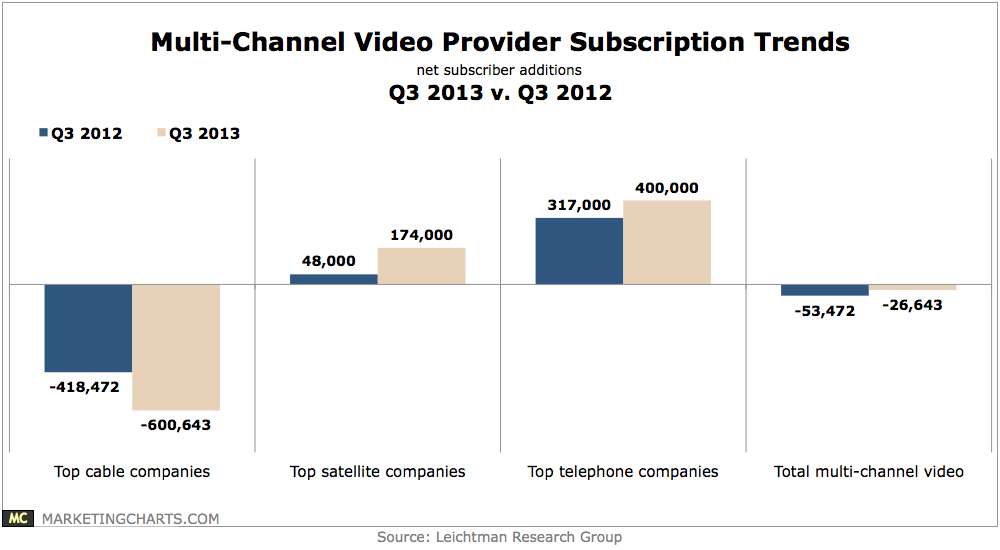
The top multi-channel video providers – representing 94% of the market – lost almost 27,000 subs in Q3, an improvement from a 50,000-strong loss in Q3 2012.
Read MoreTime Spent Watching Television Among Pay TV Subscribers, August 2013 [CHART]
The majority of pay TV subscribers—almost 56%—watched between 1 and 3 hours of television daily.
Read MoreValue Of Live Anywhere Pay-TV, October 2013 [CHART]
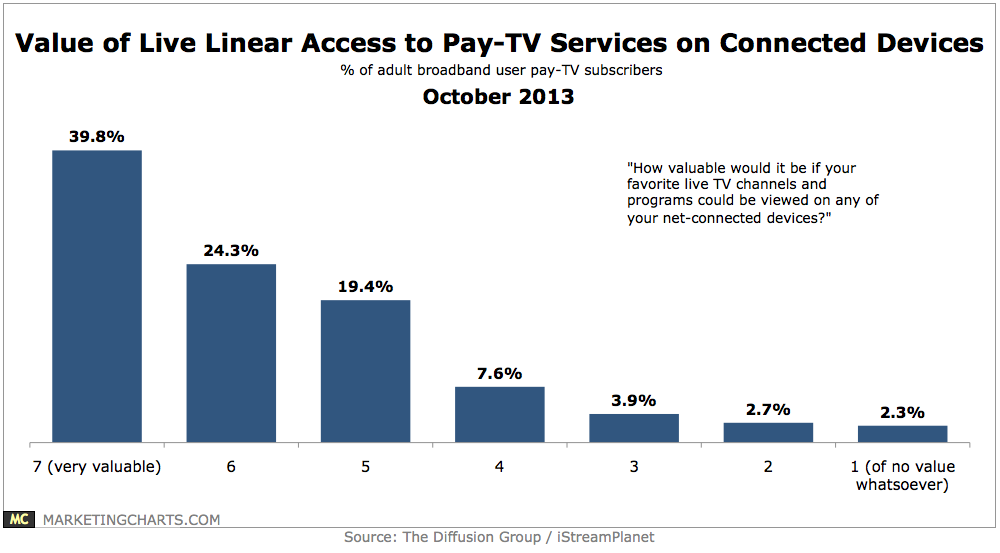
Among adult pay-TV subscribers who also use a home broadband service, more than 8 in 10 feel that the ability to view live TV channels and programs on any net-connected device would be valuable.
Read More