Visual Communications
Infographic Layouts
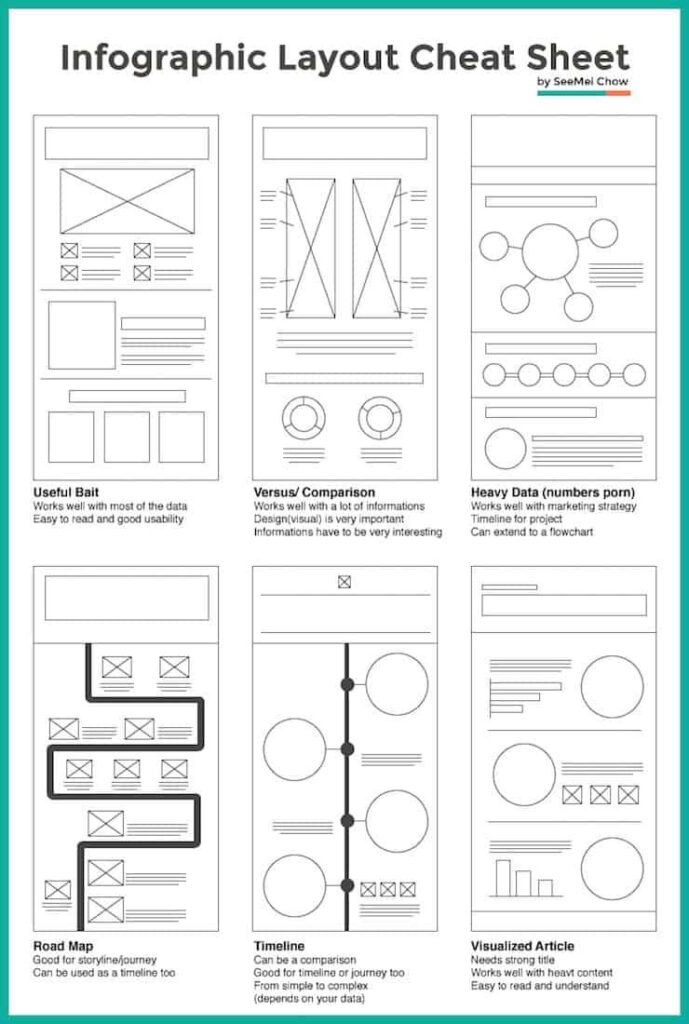
This infographic by SeeMei Chow from Picktochart illustrate six layout examples for highlighting different types of data in infographics.
Read MoreInstagram Post Engagement Rates
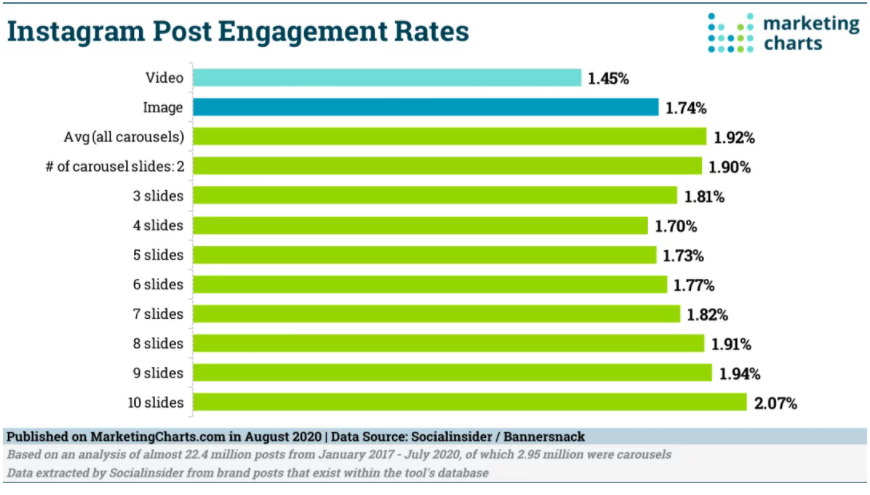
Carousel posts are offering brands flexibility in their marketing on the popular social media platform and producing great results, with an average engagement rate higher than both images and videos.
Read MoreVintage Pinterest
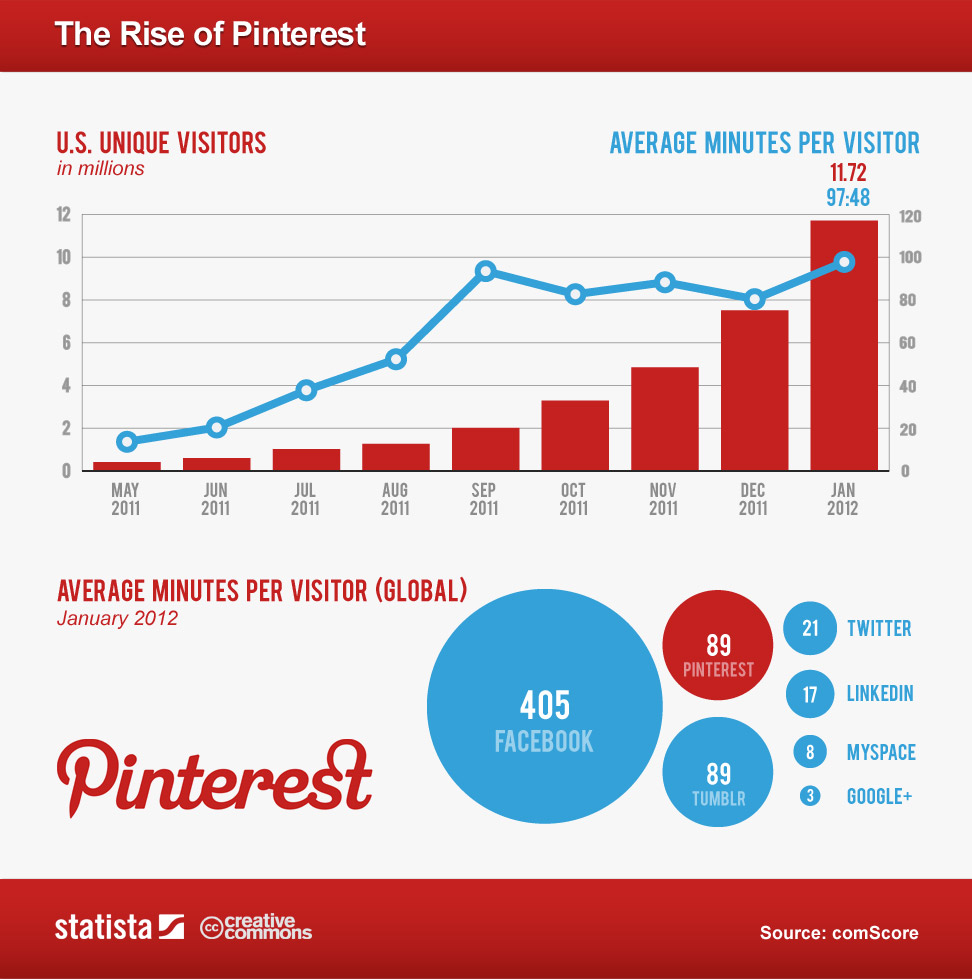
Three infographics about Pinterest back when it was the new hotness on the social media block.
Read MoreHigh-Converting Lead Magnet Content
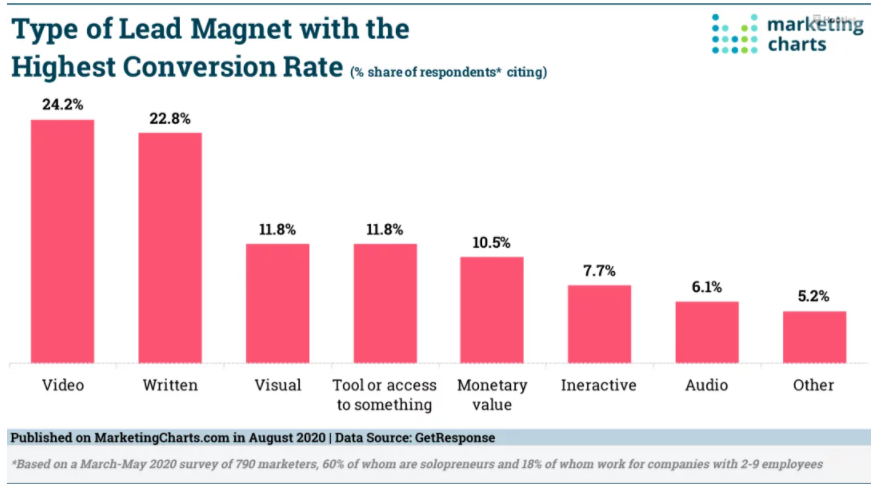
Survey data from GetReponse shows which type of offers – or ‘lead magnets’ – are resulting in higher conversion rates.
Read MoreB2B Content Consumption During The Pandemic
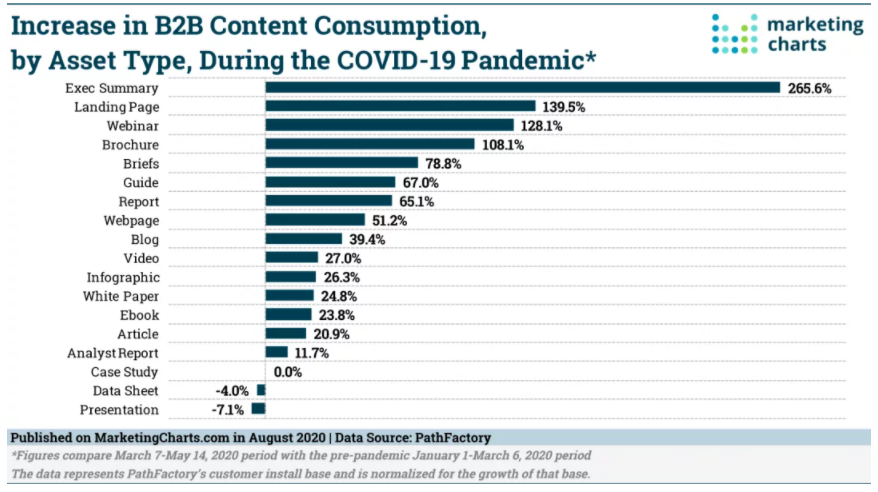
Among the myriad impacts that the COVID-19 pandemic has had on the professional world, B2B digital content engagement has increased significantly since lockdown directives were put in place, with asset views up by 40%.
Read MoreTwitter vs Instagram As A News Source, 2014-2020
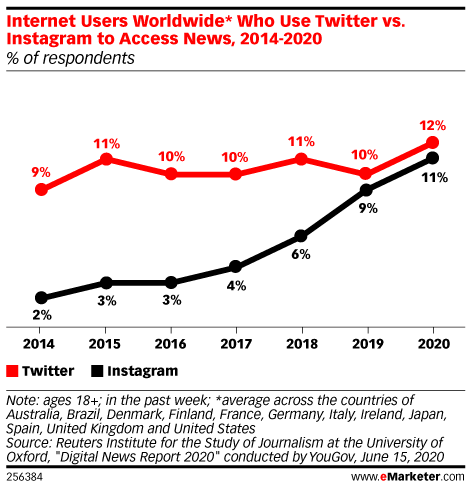
A similar percentage of users now turn to Instagram for news as they do Twitter, according to new data from the Reuters Digital News Report.
Read MoreOn-Brand About Page
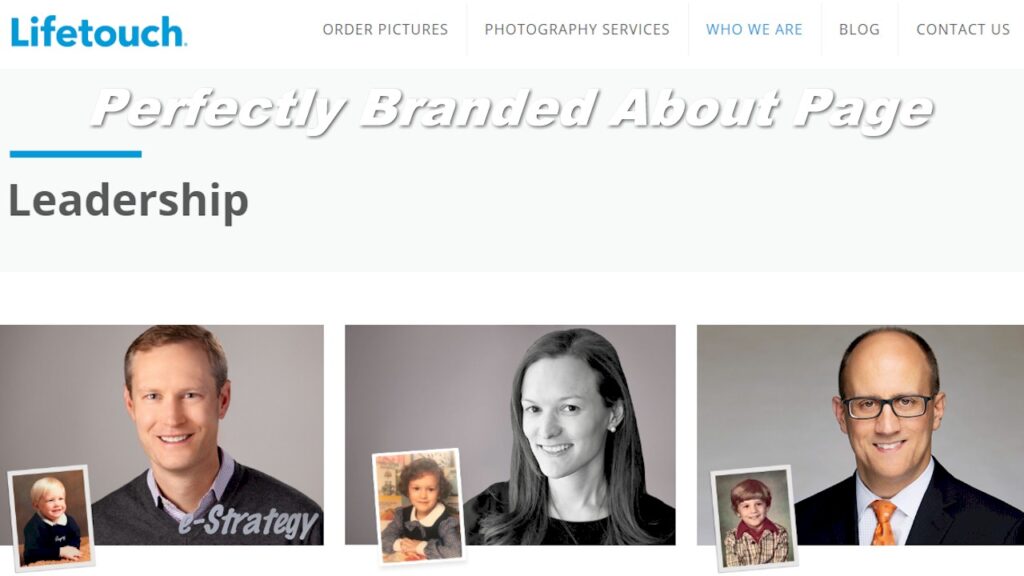
Lifetouch is a school photography company that has absolutely nailed it when it comes to the creative idea for its website leadership page.
Read MoreHow To Customize Your Twitter List Banner Images
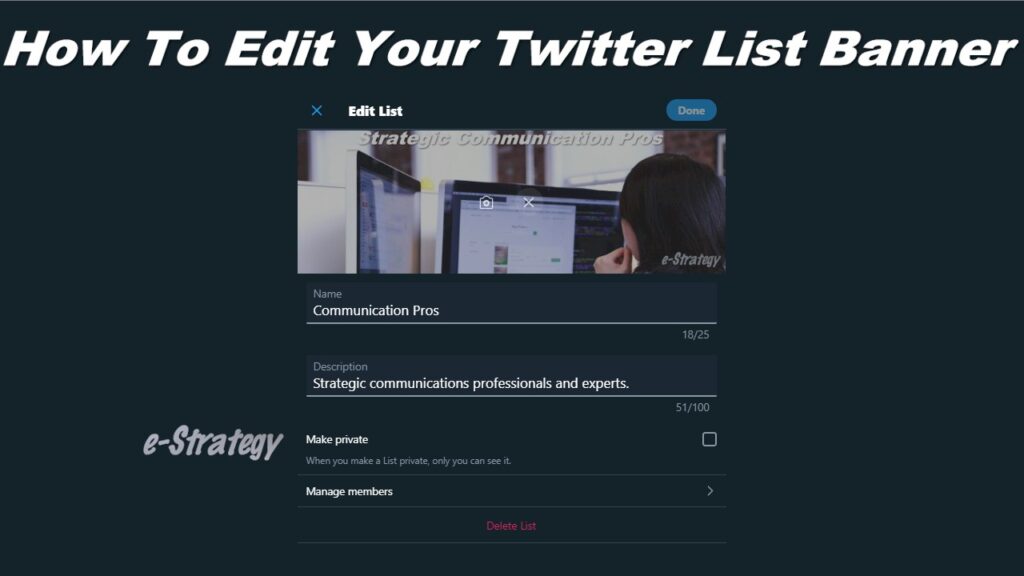
Watch this step-by-step screencast showing how to customize and optimize your Twitter List banner images.
Read MoreTop Thought Leadership Formats
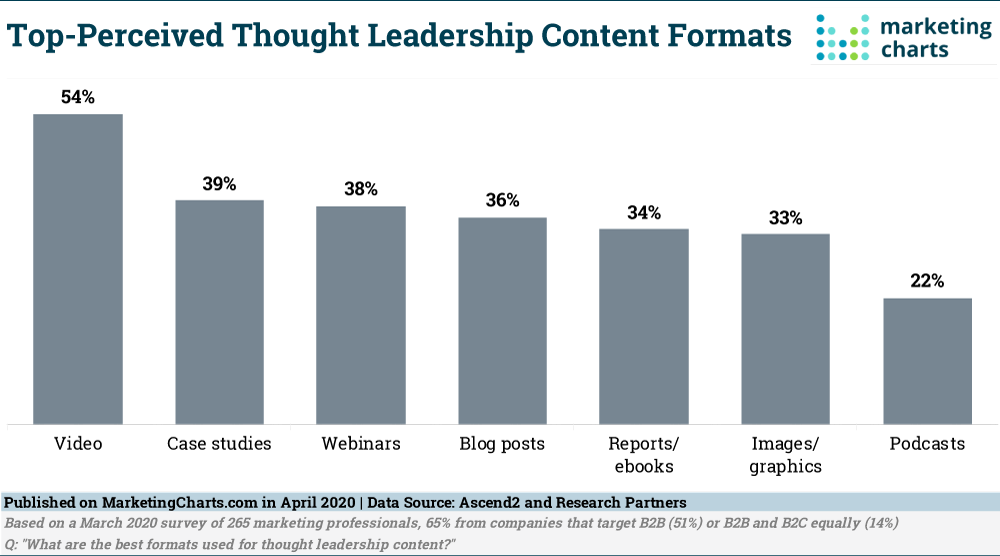
Thought leadership plays a positive role in reaching and educating target audiences as well as fostering trust and loyalty.
Read MoreSocial Media Channels By Mood
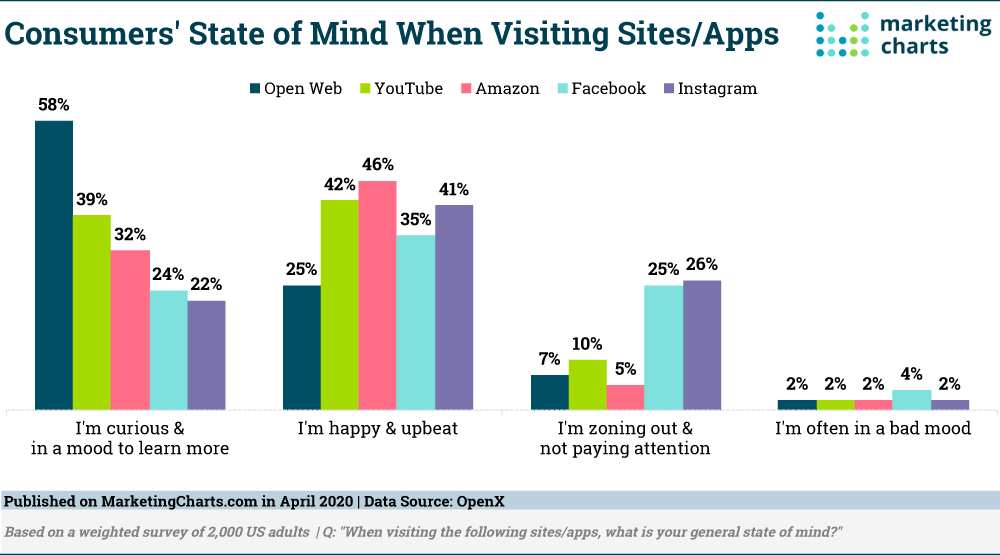
58% consumers report feeling curious and in a mood to learn when using the open web, while more are happy and upbeat when using walled gardens like YouTube, Amazon, Facebook and Instagram.
Read More