Video
Most-Hated Types Of Ads [CHART]
![Most Hated Types of Ads [CHART]](https://e-strategy.com/wp-content/uploads/2016/11/Most-Hated-Types-of-Ads.png)
American adults are almost twice as likely to dislike (61%) as to like (34%) advertising.
Read MoreEmail Reading, Glancing & Scanning By Industry [CHART]
![Email Reading, Glancing & Scanning by Industry [CHART]](https://e-strategy.com/wp-content/uploads/2016/11/Email-Reading-Glancing-Scanning-By-Industry.png)
A majority (53%) of emails are read, meaning that the recipient (presumably) looks at the message for at least 8 seconds.
Read MoreTriggered Email Adoption & Response Rates [CHART]
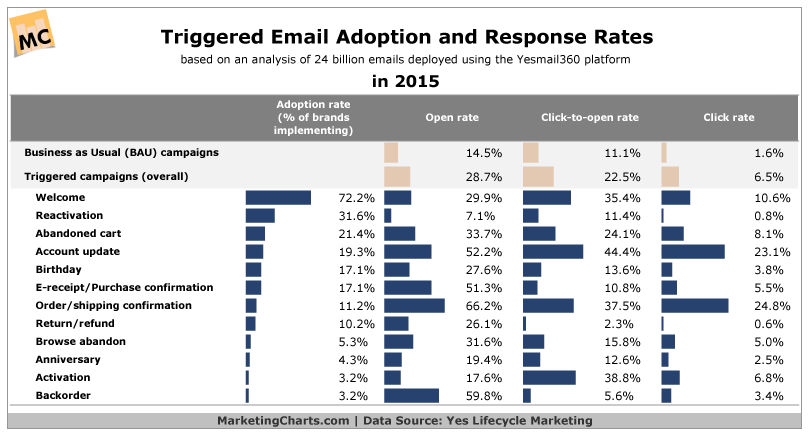
Just 2.3% of emails sent last year were triggered emails as opposed to business as usual emails.
Read MoreHow Americans Consume News By Age [CHART]
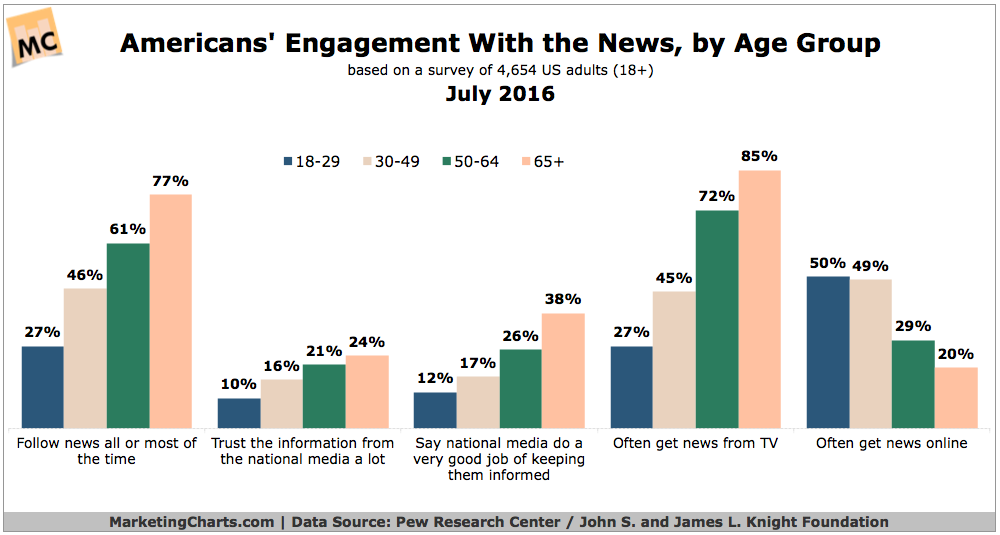
Young Americans are ‘less enthusiastic’ about the news than their older counterparts, and are less voracious consumers of news.
Read MoreDemographics Of Pinterest Users

Roughly three-in-ten online Americans (31%) use Pinterest, identical to the 31% who used the platform in 2015.
Read MoreDemographics Of LinkedIn Users
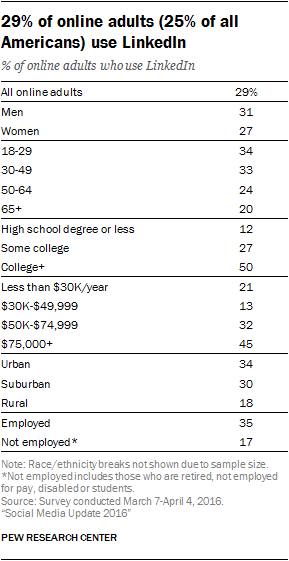
The share of online adults who use LinkedIn has remained steady over the past year: 29% report using the site, similar to the 25% who said this in 2015.
Read MoreGlobal CPMs By Social Network [CHART]
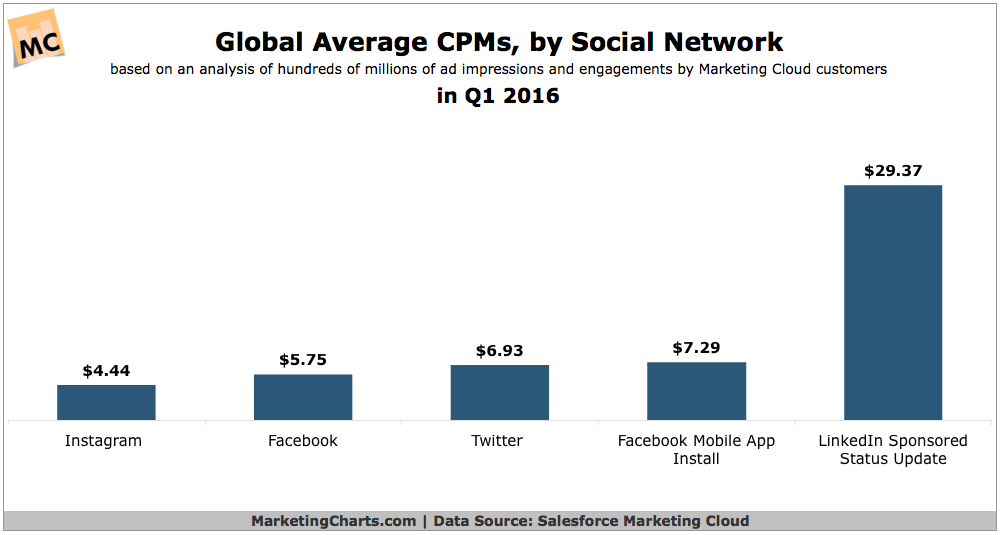
Average CPMs were lower on Instagram ($4.44) than on Facebook ($5.75) on a global basis in Q1.
Read MoreTrust In Various Institutions To Safeguard Personal Data [CHART]
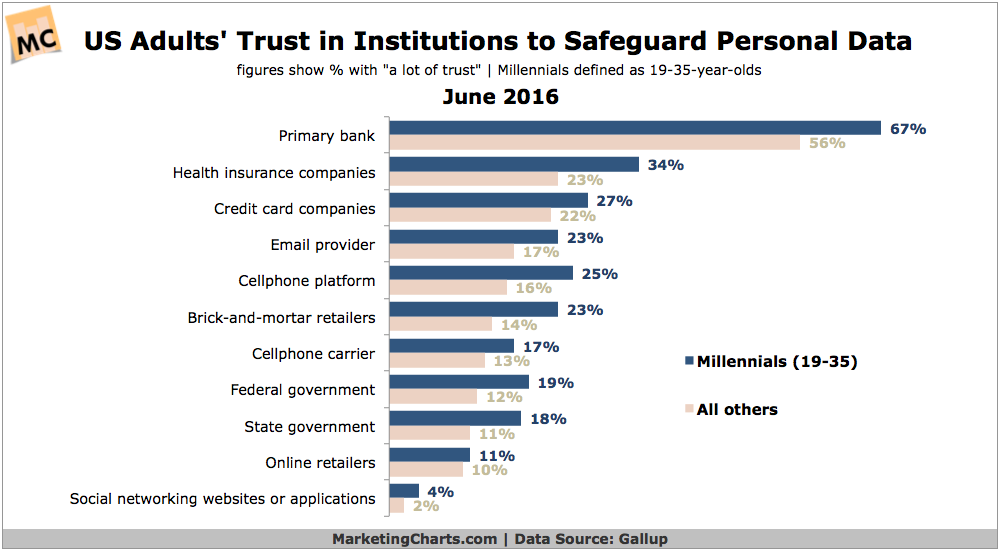
Millennials (19-35) tend to be more trusting than older generations when it comes to institutions safeguarding their personal data.
Read MoreGeographic Distribution Of Reporters & Editors, 1990-2015 [MAP]
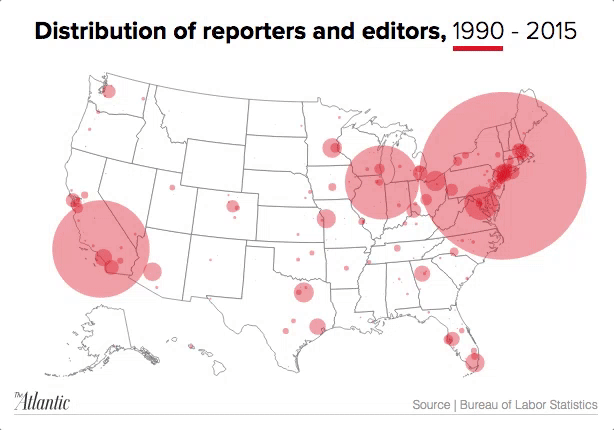
In 1960, nearly a third of reporters and editors had never attended a single year of college; in 2015, only 8.3 percent could say the same.
Read MoreMarketers Digital Skills Gaps [CHART]
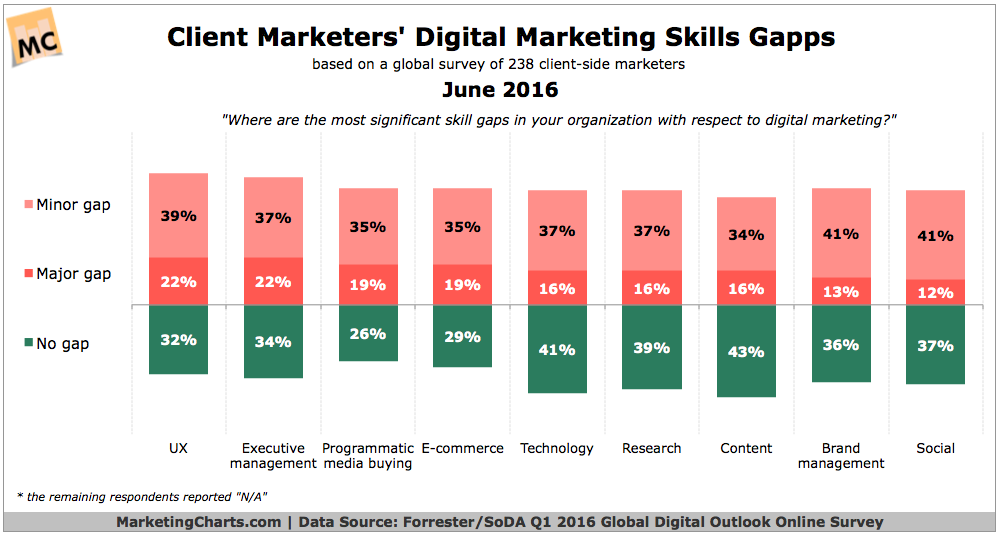
84% of marketers believe that the level of complexity faced by marketing professionals over the next 5 years will be high or very high.
Read More