Video
How People Shared Their Customer Service Experiences, 2013 [CHART]
Customers were more likely to share bad customer service experiences than good ones, no matter what communication channel they used.
Read MorePositive & Negative Customer Service Factors, 2013 [TABLE]
Among those who said they had had a positive customer service experience, more said it was because they received a quick resolution to their problem, rather than a desirable outcome.
Read MoreBeyond Social Media: AP Twitter Hack, Kmart #ShipMyPants & Vibrating Underwear App [PODCAST]

This week: AP Twitterhacked; Kmart’s #ShipMyPants; April Blizzards; Boston Bombing Virtual Witch Hunts & Media Fails; Vibrating Underwear App; Amazon Originals; Cap’N Crunch Late Night; Rookie News Anchor Fail; Shiny New Stuff & Daily Numbers.
Read MoreSocial Media's Purchase Influence Over Mothers, April 2013 [CHART]
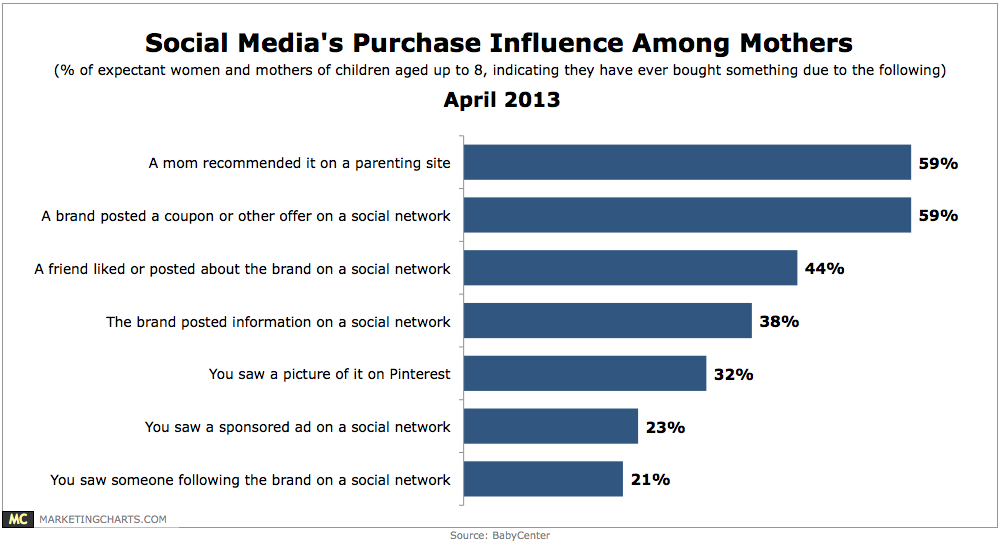
Mothers are 20% more likely than the general population to use social media.
Read MorePrimetime TV Viewers By Income, April 2013 [CHART]
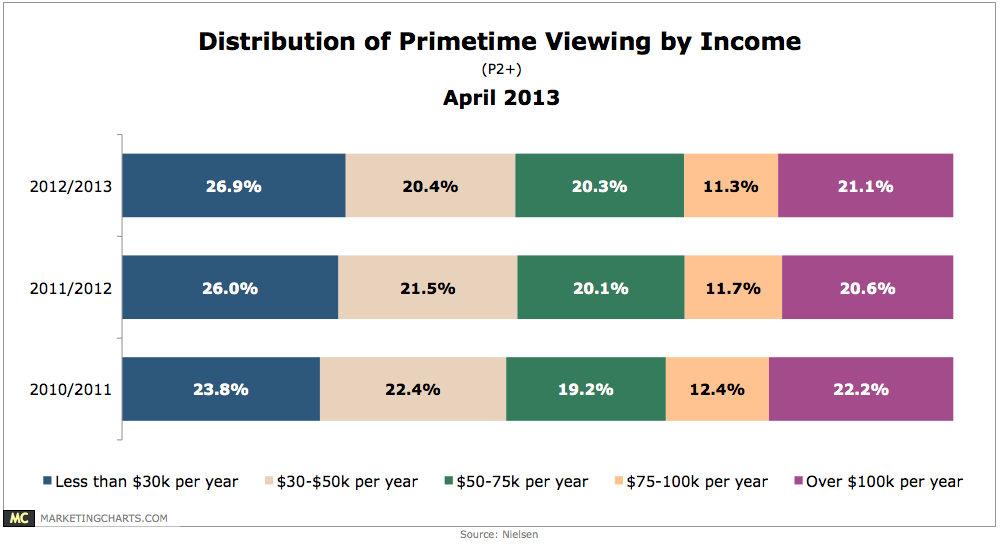
Although they watch less TV during the day, wealthy households (income of more than $100k per year) still make up more than one-fifth share of primetime viewing.
Read MorePreferred Social Logins For Consumer Brand Sites, Q2 2012-Q1 2013 [CHART]
On consumer brand sites, Google made the biggest gains in social sign-in share.
Read MoreEvian Babies Return [VIDEO]

Evian has brought the dancing babies back for a reprise. Can’t go wrong with dancing babies.
Read MoreConsumer Interest In Targeted Online Ads, April 2013 [CHART]
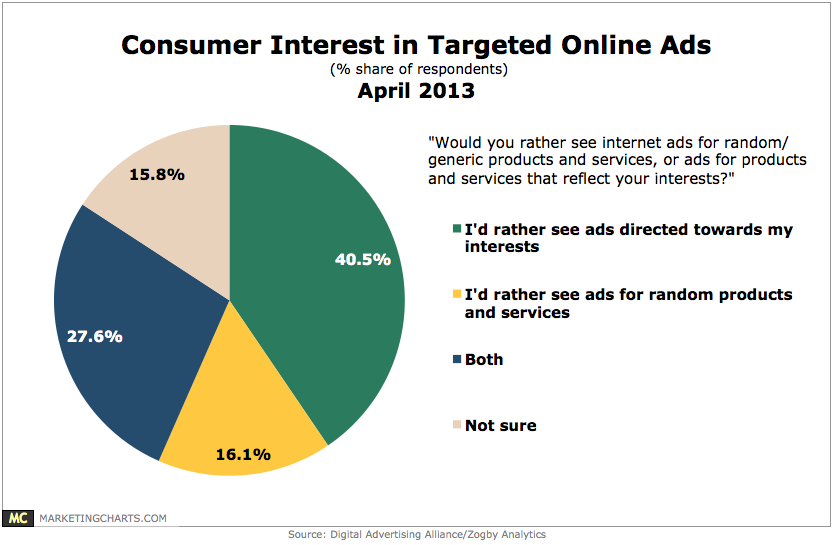
40.5% of consumers would rather see ads directed towards their interests rather than random ads, while another 27.6% were content to see both.
Read MoreNetwork TV Streaming & Pay TV, 2011 vs 2012 [CHART]
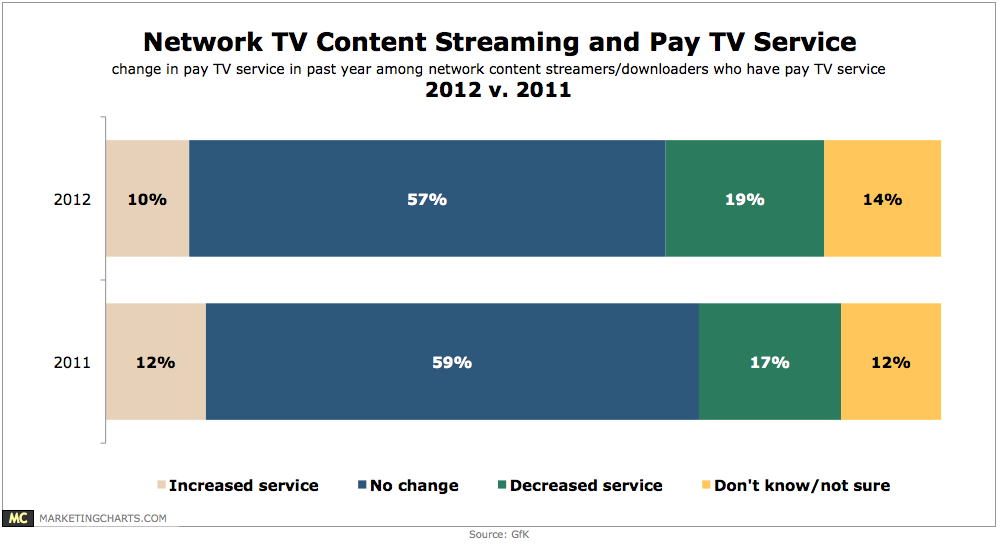
19% of TV video streamers and downloaders in 2012 reported decreasing service (“cord-slicing”) in the past year.
Read MoreGlobal mCommerce Interest By Gender, April 2013 [CHART]
Men appear to be more interested in using their mobile phones than women.
Read More