Video
French Online Buyers, Q3 2012-Q4 2013 [CHART]
Only 37.5% of French citizens ages 11 and older had made a digital purchase in the month before polling, equating to 20.4 million people across the country.
Read MoreFrench Consumers Who Bank Online, Computer vs Mobile, Q4 2013 [CHART]
Nearly seven in 10 French web users ages 15 and older said they had carried out at least one banking activity on a computer at home in the month before Q4 2013 polling.
Read MoreOnline Video Viewer Demographic, May 2014 [TABLE]
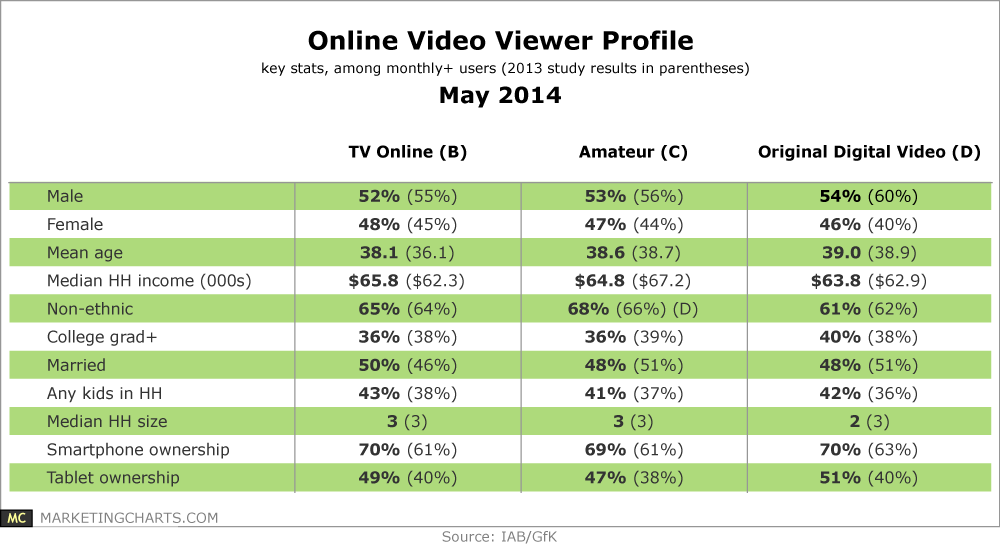
Online video is attracting a growing audience, with 1 in 5 or more American adults watching a TV show online (28%), amateur content (31%), or original digital video (22%) on at least a monthly basis.
Read MoreProfessional Activities Conducted On Social Media By UK Business Pros, January 2014 [CHART]
72% of UK business pros consider LinkedIn it a trustworthy source of professional content—compared with 37% for Facebook and 30% for Twitter.
Read MoreUS B2C mCommerce Sales Share By Segment, 2012-2018 [CHART]
In 2013, travel totaled 34.1% of the nearly $400 billion US eCommerce market.
Read MoreUS Online Travel Sales By Channel, 2012-2018 [CHART]
US mobile travel sales totaled $16.36 billion in 2013 and will increase another 59.8% this year to reach $26.14 billion.
Read MoreSmart Phone Commerce Metrics By Day Of The Week, Q1 2014 [CHART]
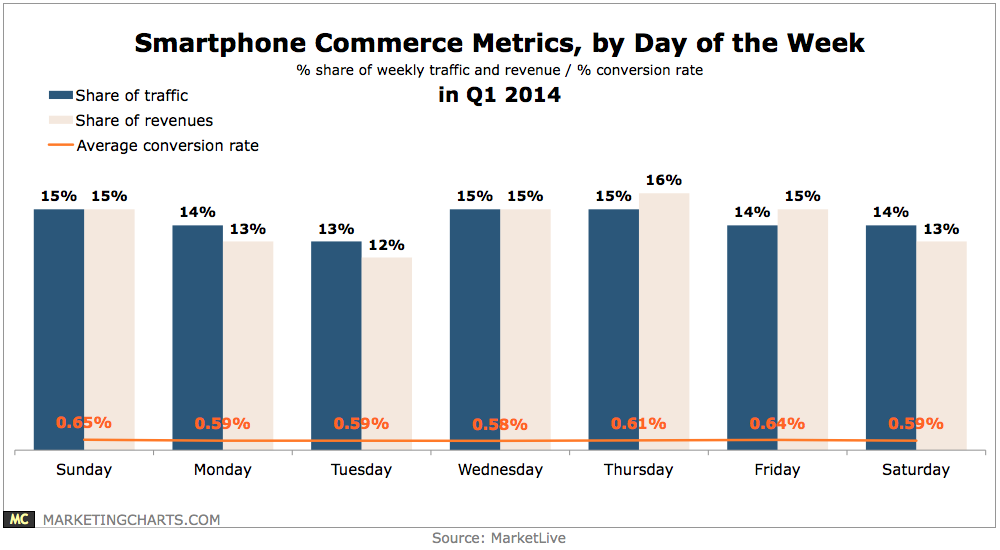
Mondays and Saturdays tied for the second-largest share of weekly revenues (15% each).
Read MoreTablet Commerce Metrics By Day Of The Week, Q1 2014 [CHART]
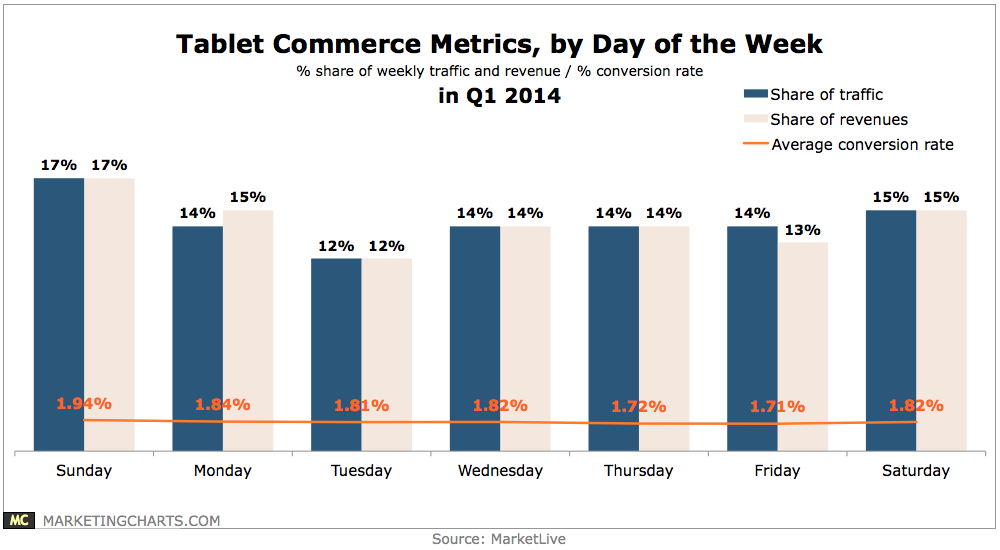
Mobile accounted for 10.5% of retail e-commerce spending last year.
Read MoreCustomer Experience Leaders vs Laggards, May 2014 [TABLE]
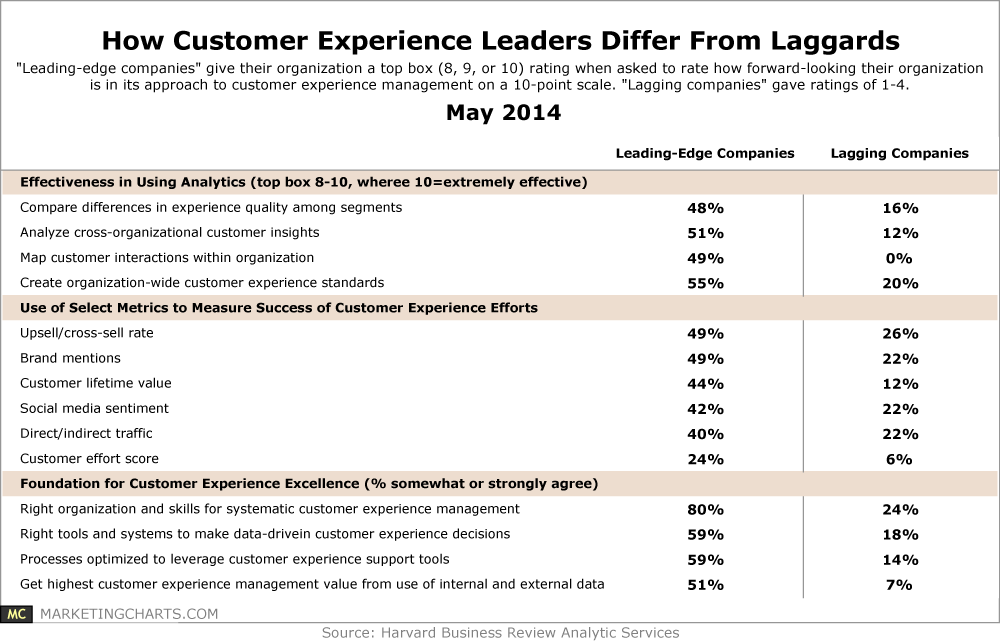
58% believe their customer retention rates are very successful (top-3 box score on a 10-point scale), versus just 20% of lagging companies who concur.
Read MoreNumber Of TV Channels Average Household Watches, 2008-2013 [CHART]
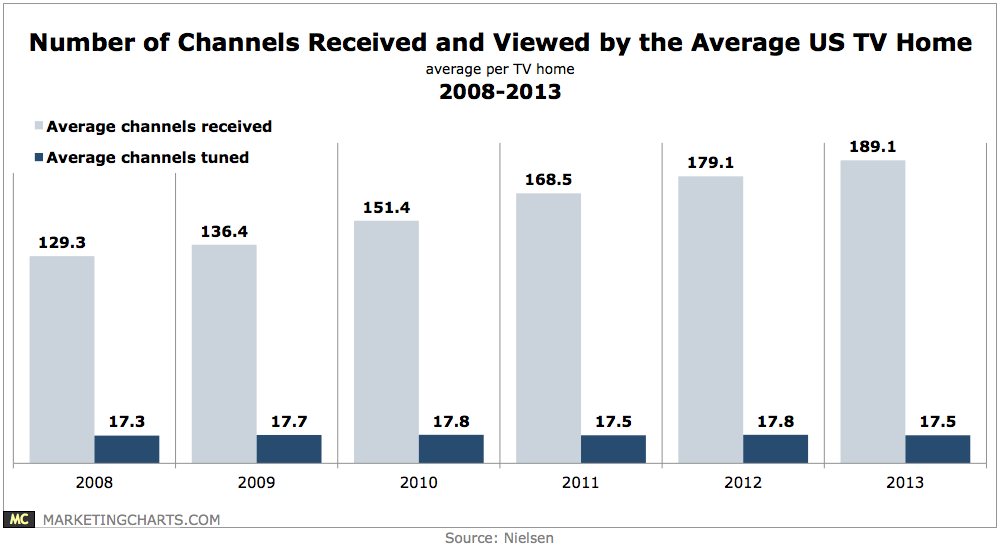
The number of channels watched by the average US TV home has remained between 17 and 18 each year since 2008, despite an ever-growing number of channels received by the average TV home.
Read More