Video
TV Programs With The Most Loyal Social Fans [TABLE]
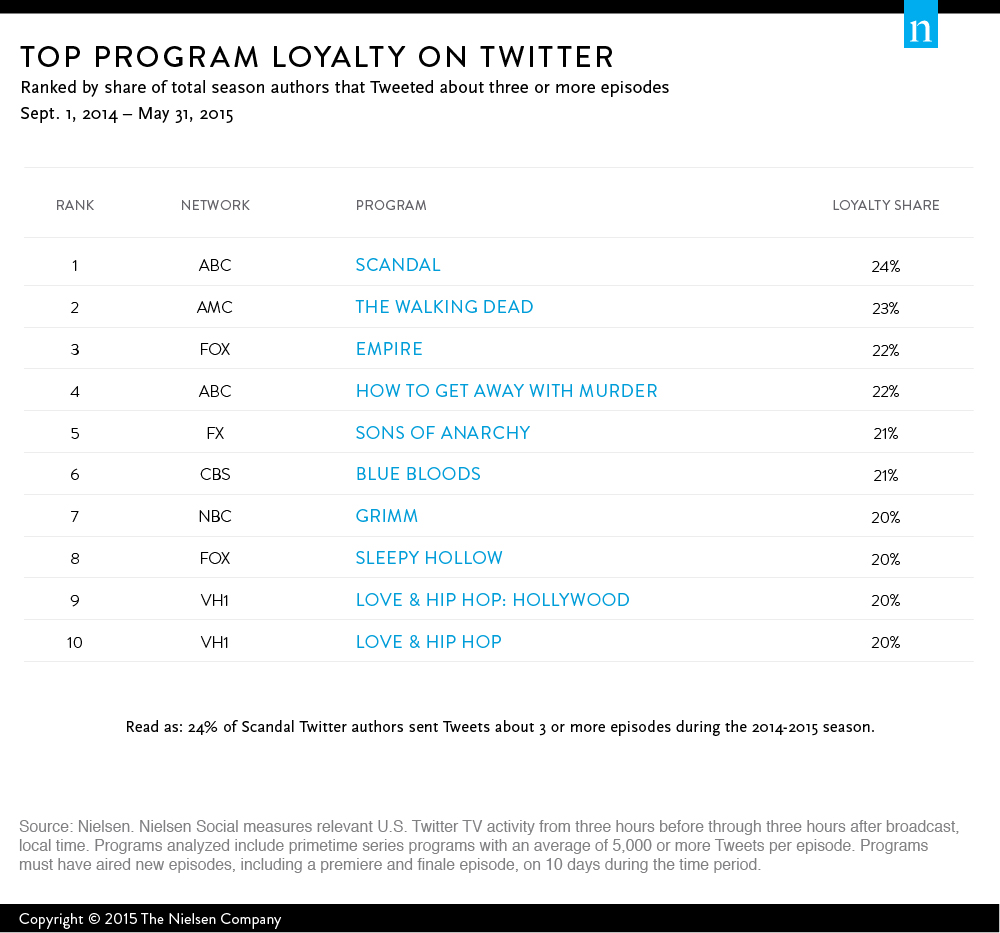
A Nielsen study revealed which programs had the most socially loyal fans during the past 2015 TV season.
Read MoreHow Social TV Fans Join Program Conversations [CHART]
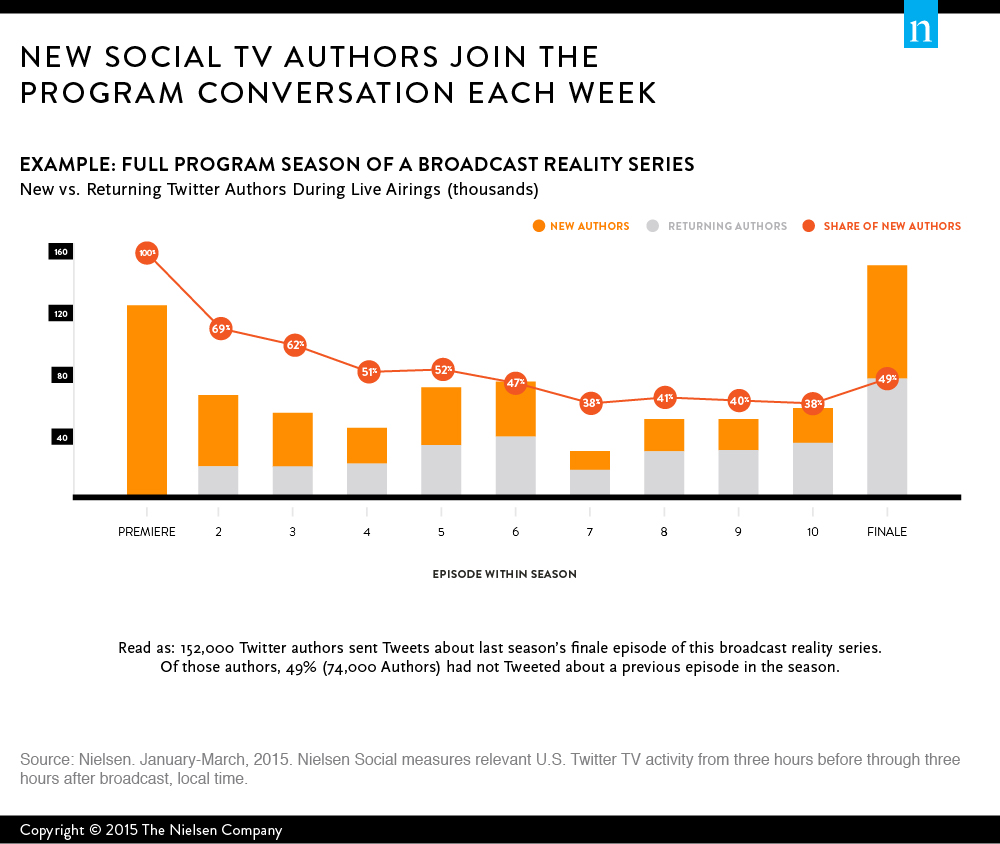
A Nielsen survey demonstrates how social TV fans join Twitter conversations about their favorite programs during the course of a season.
Read MoreDevices Mothers Use To Check Facebook, 2012-2015 [CHART]
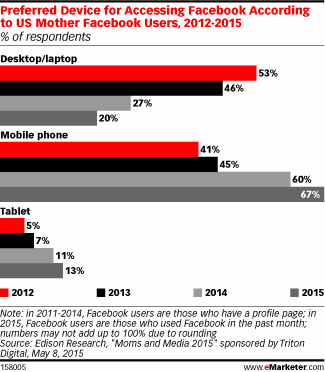
In 2015, 67% of mother Facebook users logged on to the social network via mobile phone, up from 60% in 2014 and just 45% in 2013.
Read MoreFrequency With Which Parents Check Facebook, 2012-2015 [CHART]
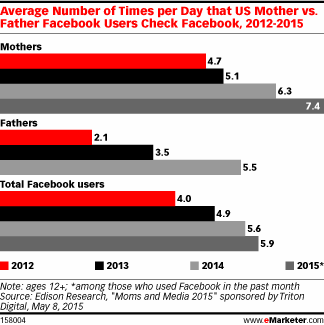
US mother Facebookers studied checked the social network 7.4 times a day on average, vs. 5.9 times for total users.
Read MoreElements Of An Email Signature [INFOGRAPHIC]
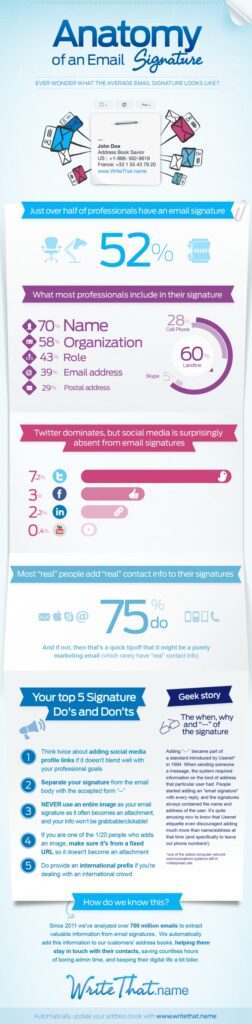
This infographic illustrates the essential elements of a professional email signature and statistics about email signature use.
Read MoreUS LGBT Media Consumption By Generation, August 2015 [TABLE]
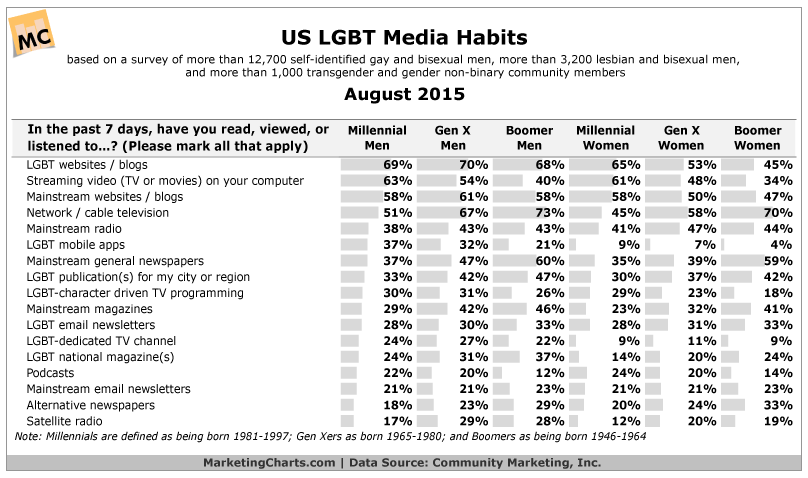
LGBT websites and blogs remain the most popular form of media among Millennial LGBTs.
Read MoreKids' Summer Media Consumption, August 2015 [CHART]
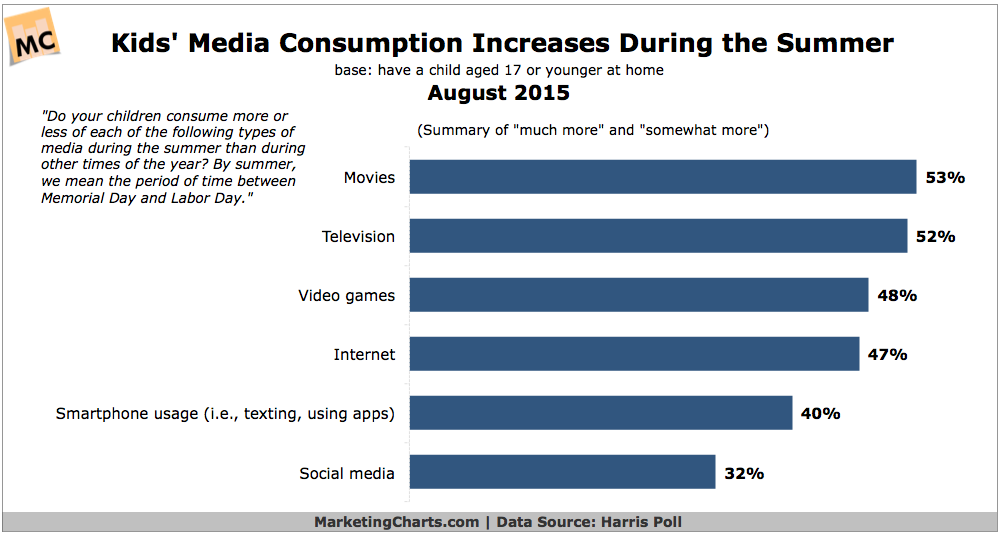
Kids’ media consumption goes up during the summer, particularly when it comes to movies and TV.
Read MoreBack to School Shopping Scheduling, August 2015 [CHART]
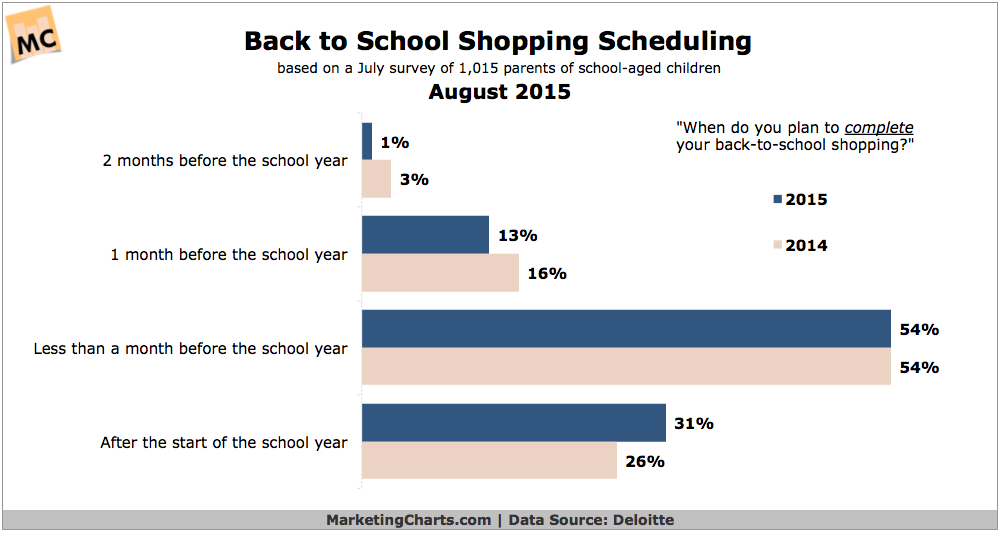
MasterCard research reminds that last year, August 29 was the heaviest shopping day of the Back To School season.
Read MoreSearch Ranking Factor Trends, August 2015 [CHART]
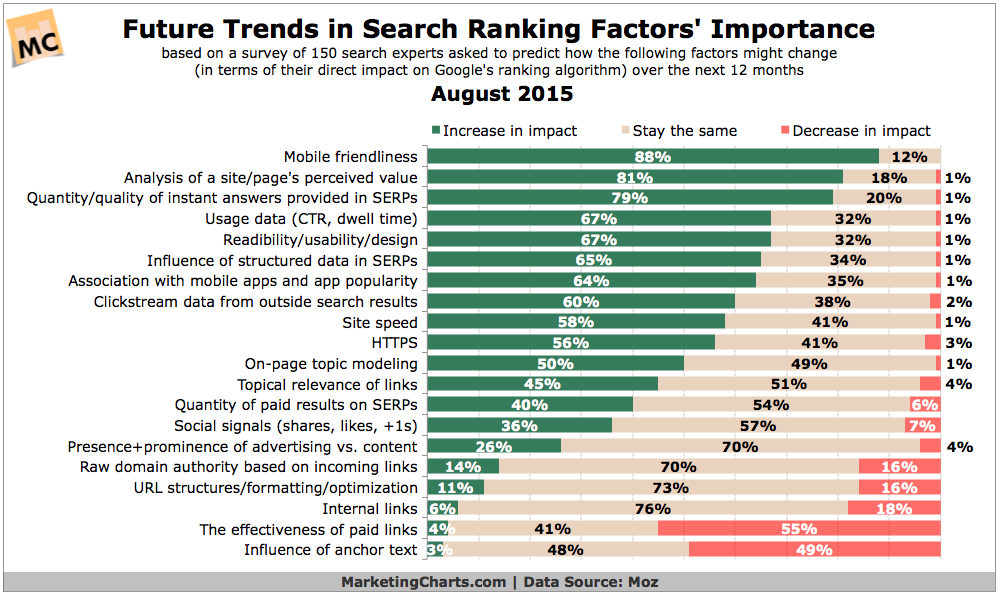
The impact of relevant content continues to grow, while the number of links to a given page remains influential though potentially decreasing in value.
Read MoreTime Spent Watching Periscope Videos Per Day, 2015 [CHART]

Periscope users watch an average of 40 years of video per day.
Read More