Consumer Behavior
Primetime TV Viewers By Income, April 2013 [CHART]
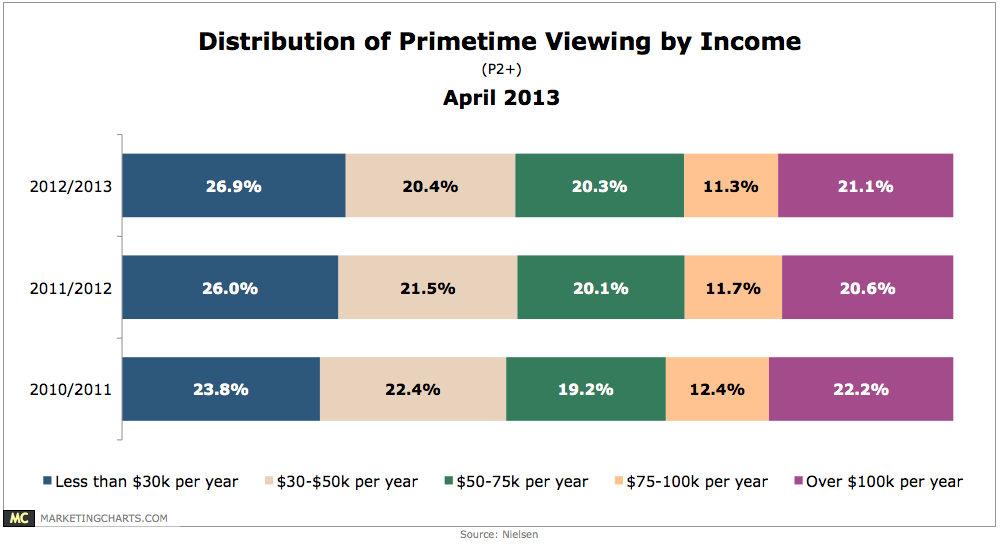
Although they watch less TV during the day, wealthy households (income of more than $100k per year) still make up more than one-fifth share of primetime viewing.
Read MorePreferred Social Logins For Consumer Brand Sites, Q2 2012-Q1 2013 [CHART]
On consumer brand sites, Google made the biggest gains in social sign-in share.
Read MoreConsumer Interest In Targeted Online Ads, April 2013 [CHART]
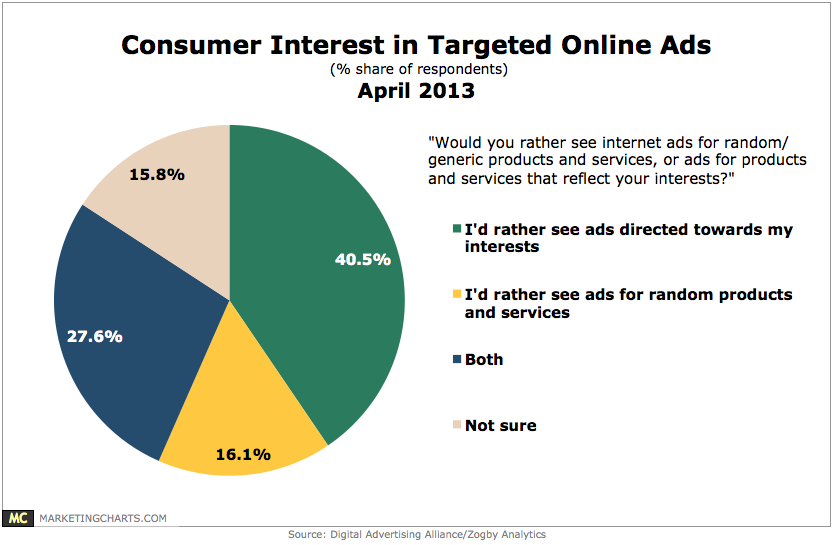
40.5% of consumers would rather see ads directed towards their interests rather than random ads, while another 27.6% were content to see both.
Read MoreNetwork TV Streaming & Pay TV, 2011 vs 2012 [CHART]
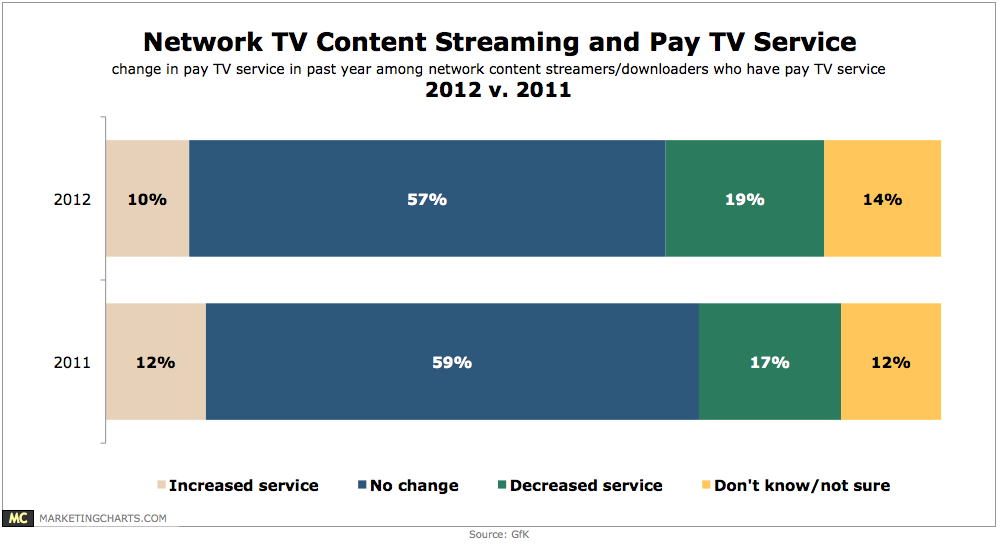
19% of TV video streamers and downloaders in 2012 reported decreasing service (“cord-slicing”) in the past year.
Read MoreGlobal mCommerce Interest By Gender, April 2013 [CHART]
Men appear to be more interested in using their mobile phones than women.
Read MoreSmall Biz Owners' Social Media Activity, April 2013 [CHART]

81% of small business owners say they’re spending more (49%) or the same amount (32%) of time on social media compared to a year ago.
Read MoreConsumers & Cross-Channel Retail, April 2013 [TABLE]
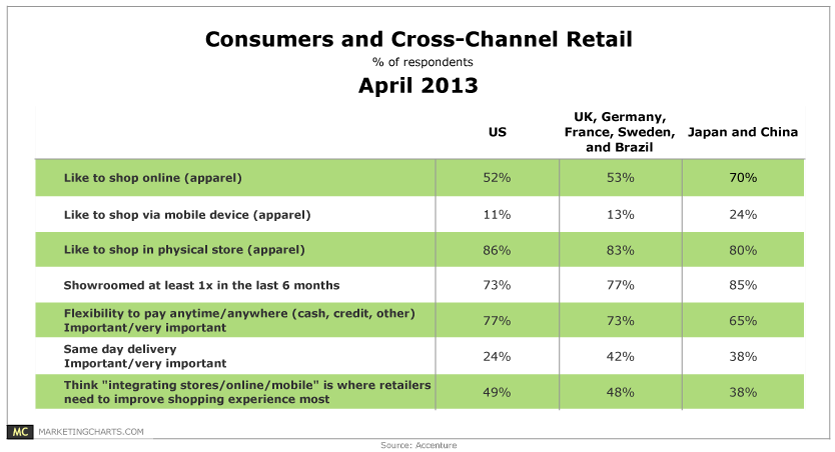
49% of US consumers believe the best thing that retailers can do to improve the shopping experience is to better integrate in-store, online and mobile shopping channels.
Read MoreUS Local Mobile vs Desktop Search Volume, 2011-2016 [CHART]
Google estimated that 20% of searches across all platforms worldwide have local intent.
Read More
How People Binge On TV, February 2013 [CHART]

Most US TV viewers (63%) had used an online subscription service (like Netflix) to binge-view TV.
Read More