Consumer Behavior
American eReader vs Tablet Owners, August 2013 [CHART]
Only 24% of respondents owned an ereader or similar device intended primarily for reading.
Read MoreTop 10 Countries By Digital Natives Penetration, October 2013 [TABLE]
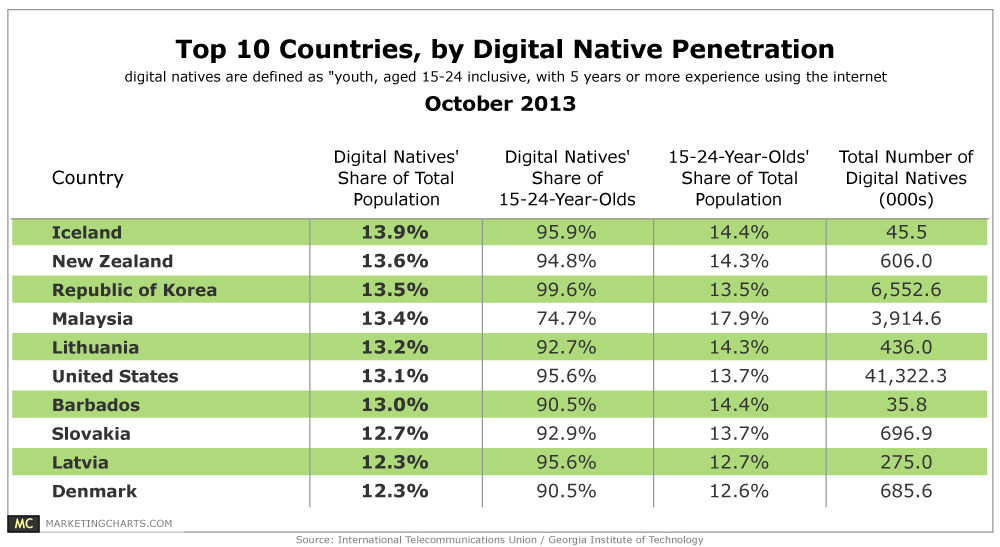
If all the “digital natives” in the world combined to form their own country, it would be slightly larger than the US.
Read More10 Most-Loved Brands, October 2013 [CHART]
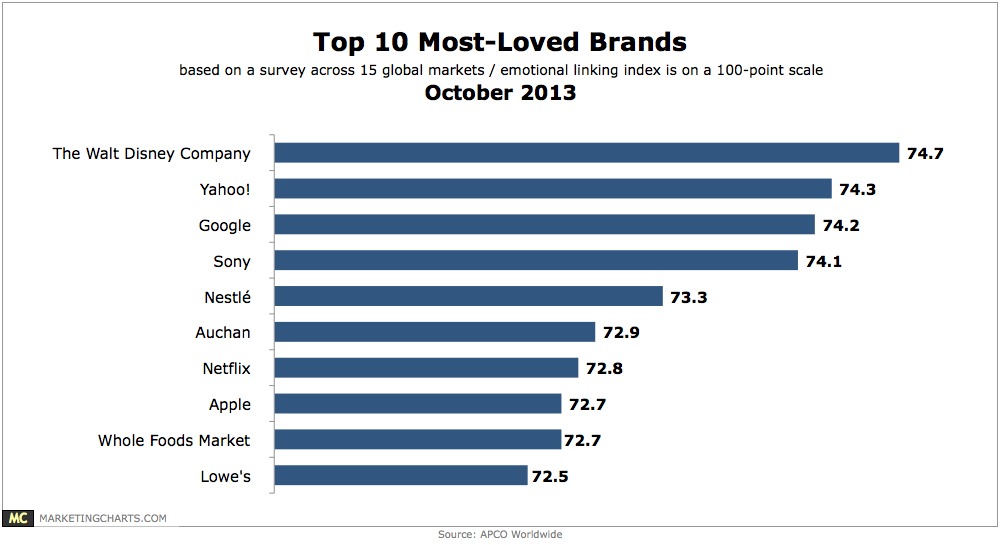
The Walt Disney Company is the world’s most-loved company with an emotional linking index of 74.7.
Read MorePrimary Entertainment Devices For Young Mobile Users, October 2013 [CHART]
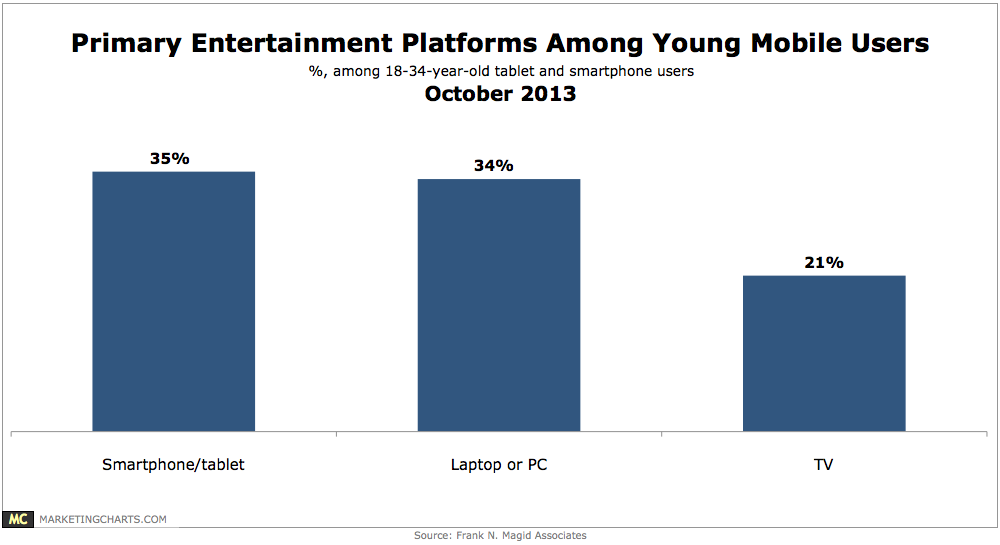
Among 18-34-year-old smart phone and tablet users, a leading 35% count those devices as their primary entertainment medium.
Read MoreOnline Video & Broadcast TV Consumption, October 2013 [CHART]
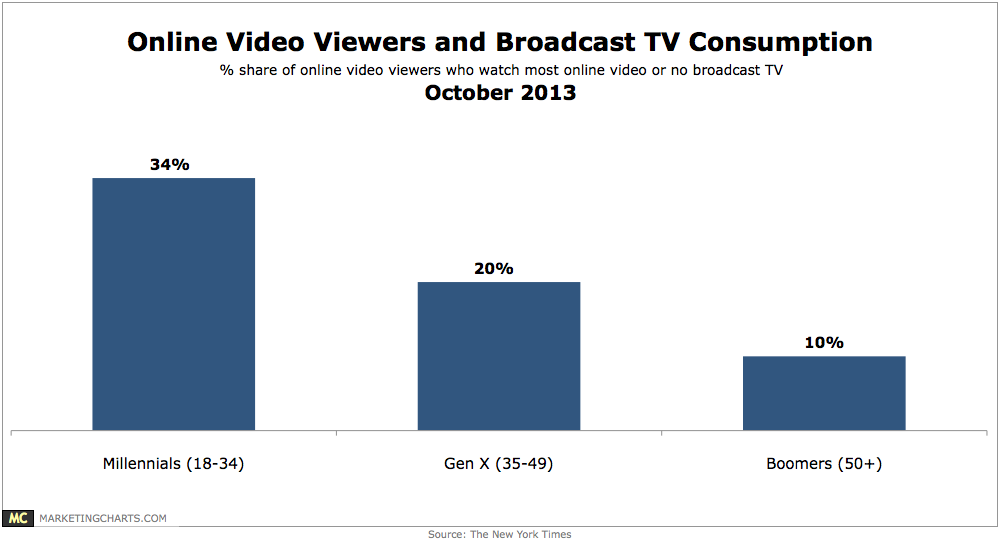
34% of Millennials (18-34) reported watching mostly online video or no broadcast TV, compared to 20% of Gen X (35-49) respondents and 10% of Boomers (50+).
Read MoreMobile & Social's Role In Holiday Shopping [INFOGRAPHIC]

This infographic from Offerpop via AllFacebook illustrates how people use mobile and social media during the holiday shopping season.
Read MoreUrgency Of Digital Transformation, October 2013 [CHART]
More than 1 in 4 executives from around the world believe the time has already come to implement digital transformation across their organizations, and that doing so is already a matter of survival.
Read More
Mobile Share Of Organic Search Traffic, Q2 2012 – Q3 2013 [VIDEO]
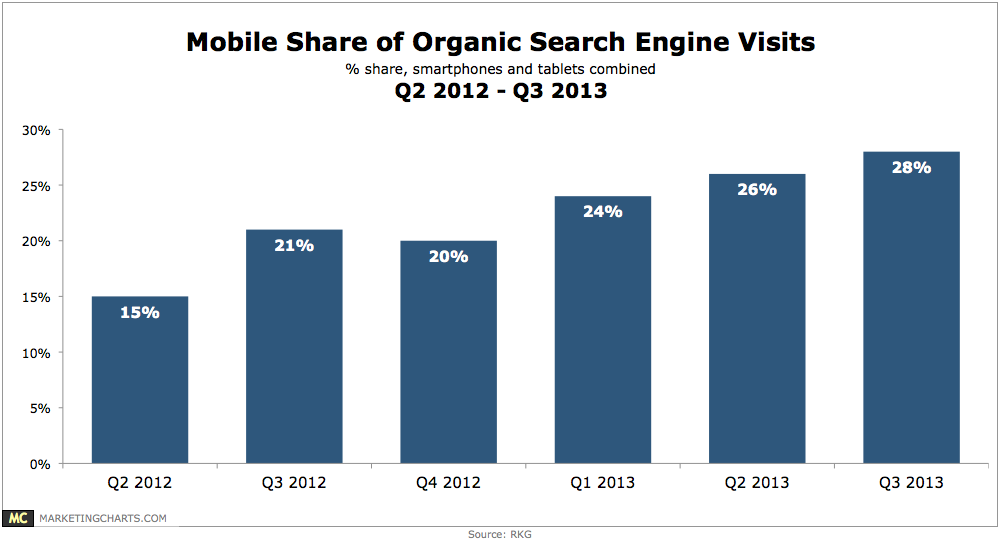
Smart phones and tablets combined to account for 28% of organic search traffic in Q3, up from 26% a quarter earlier and 21% a year earlier.
Read MoreChannels Use To Recommend Products & Services, October 2013 [CHART]
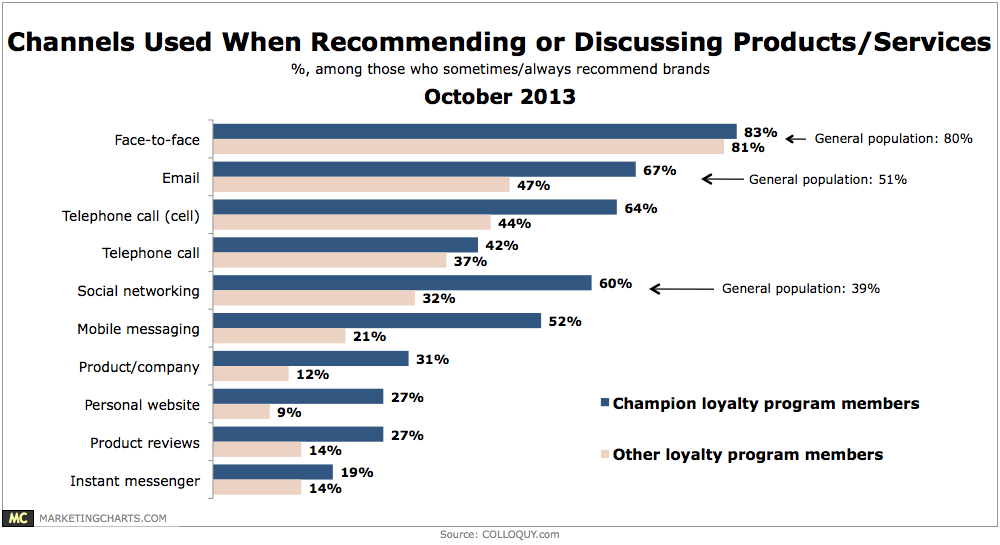
Among consumers who sometimes or always recommend brands to others, sharing information face-to-face (80%) remains by far the most popular method of doing so, far ahead of email (51%) and social networks (39%).
Read More