Consumer Behavior
Top 10 Local US Markets By Tablet Penetration, November 2013 [CHART]
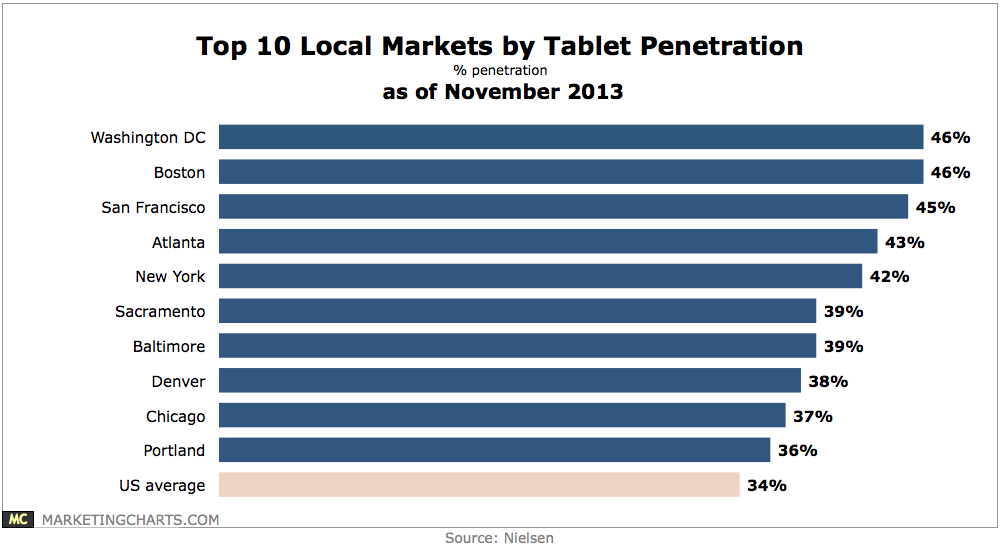
Nielsen looked at tablet penetration, with its 34% average across the US in November 2013 significantly below recent estimates of more than 40% penetration in December and January.
Read MoreTop 10 Local Markets By Smart Phone Penetration, November 2013 [CHART]
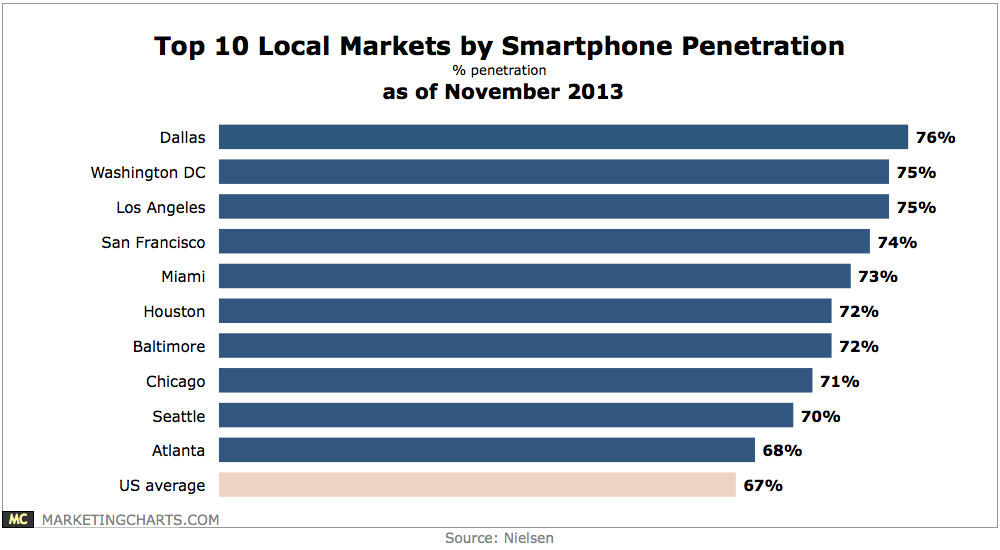
Smart phone penetration continues to grow, exceeding 65% of the US mobile subscriber market during the fourth quarter of 2013.
Read MoreUS Penetration Among Select Social Networks During November 2013 [CHART]
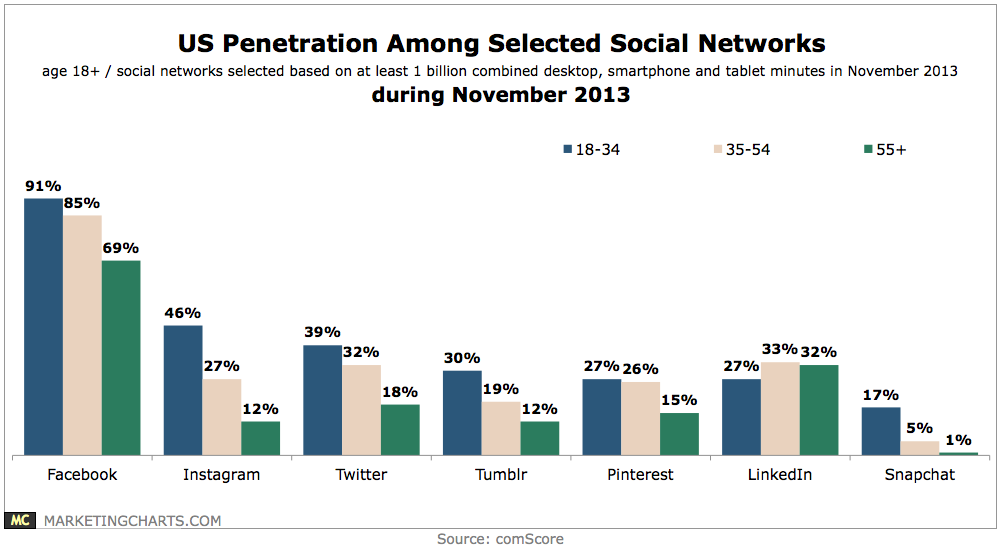
Some 17% of Millennials (18-34) use Snapchat on a monthly basis.
Read MoreReferred Video Start Traffic Share, Q4 2013 [CHART]
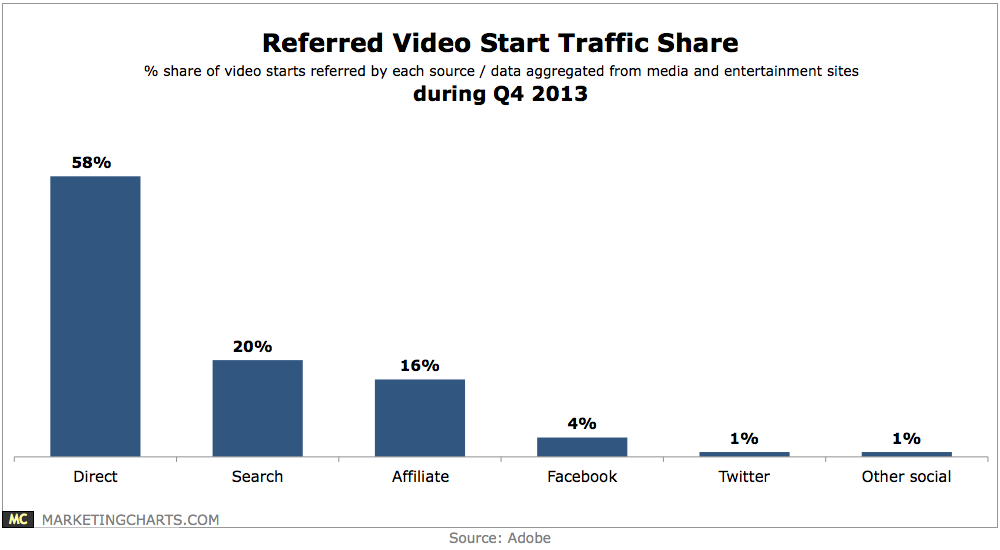
When it comes to branded video starts, search is a far bigger referrer than social.
Read MoreDoctors' Informational Tasks By Device, August 2013 [TABLE]
The most common digital activity among US physicians in the survey was accessing the internet, at 97%.
Read MoreTop Challenges Of Personalized Marketing, February 2014 [CHART]
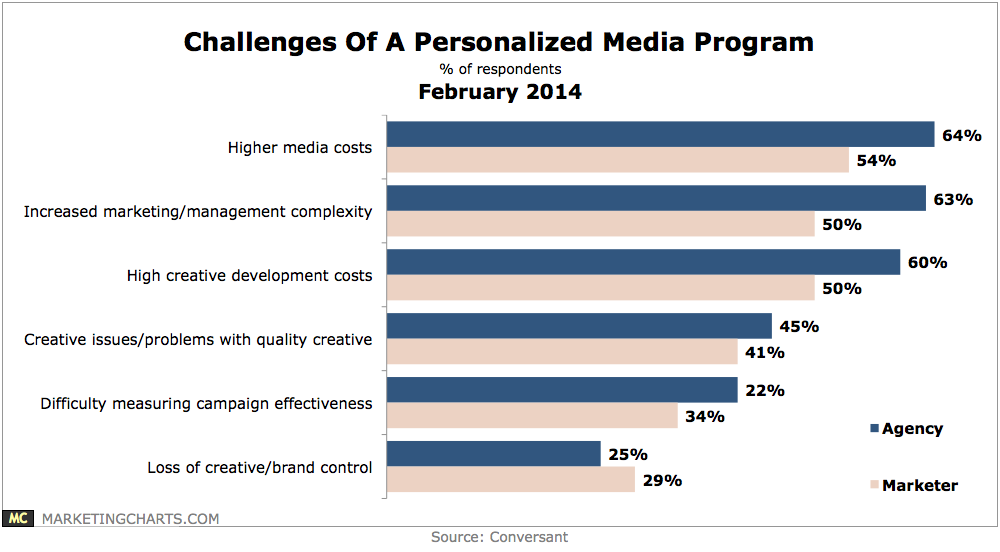
Both agencies (64%) and marketers (54%) indicated that higher media costs represent the top challenge.
Read MoreTop Benefits Of Personalized Marketing, February 2014 [CHART]
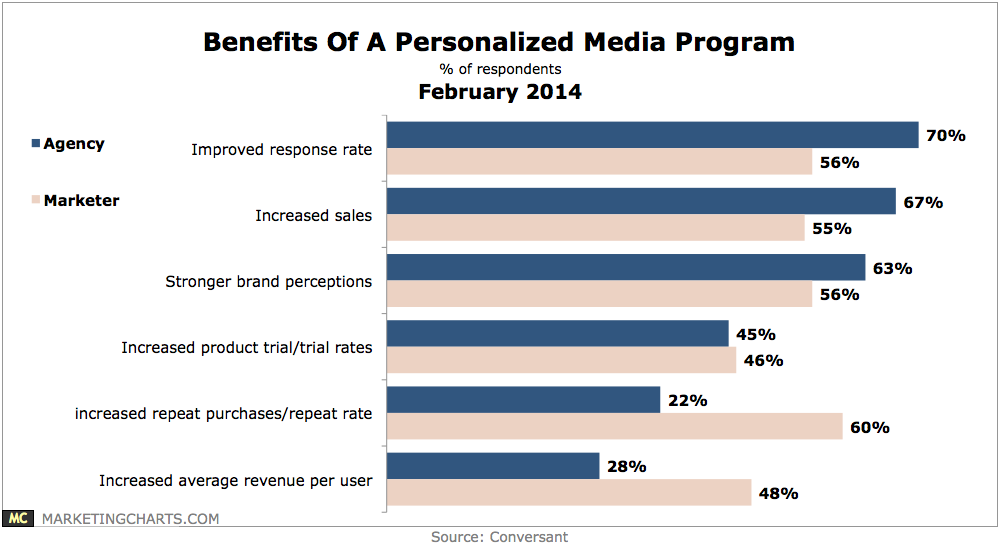
Some 77% of marketers agree that individualized messages and offers can be more effective than mass messages and offers,
Read MoreBusiness Impact Of Customer Experience Efforts, February 2014 [CHART]
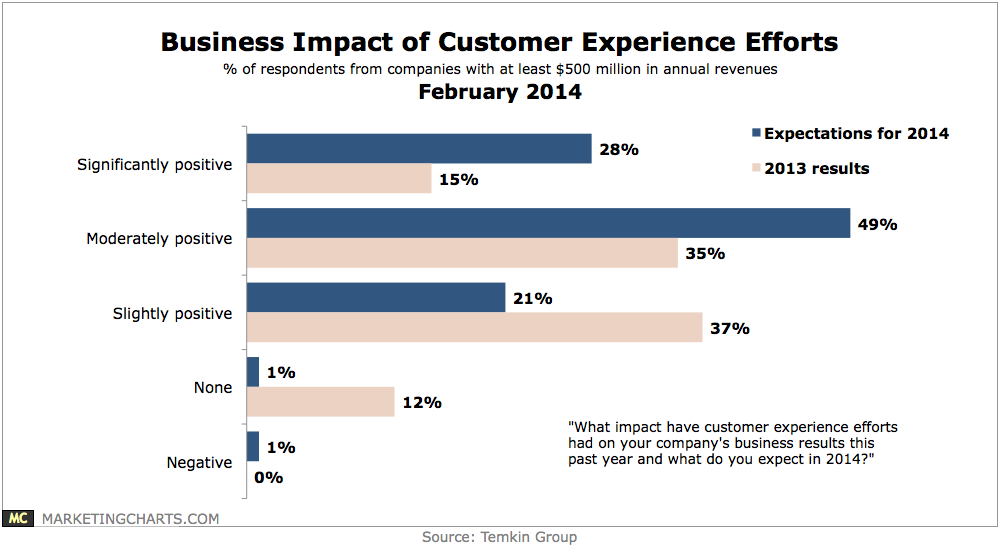
A recent study from Econsultancy found that company marketers consider customer experience (CX) to be their single most exciting opportunity this year.
Read MoreSmart Phone Share Of US Mobile Subscribers, October 2011 – December 2013 [CHART]
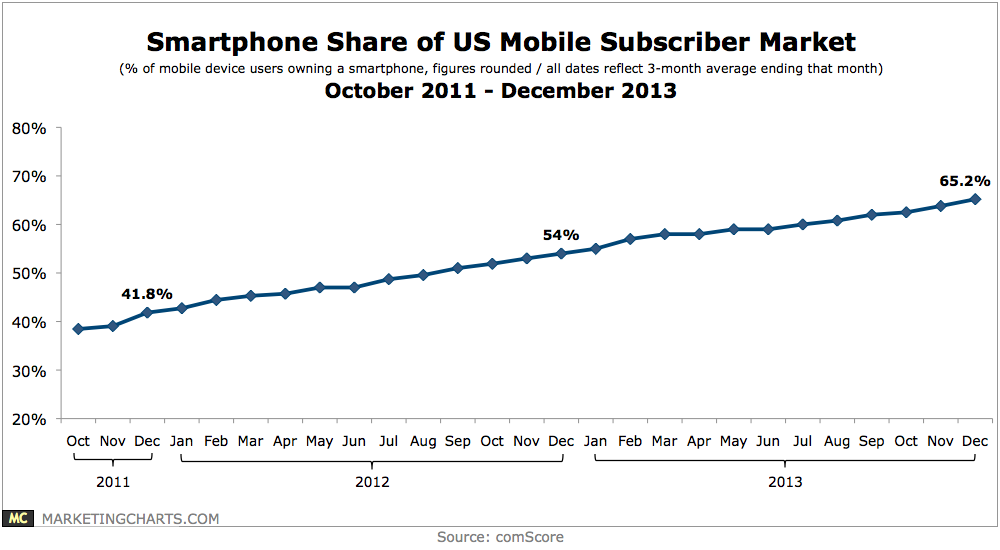
Smart phone penetration reached 65.2% of the US mobile subscriber market during the 3-month average ending in December.
Read MoreGrowing Privacy Concerns Across Popular Online Activities, 2013 vs 2014 [CHART]
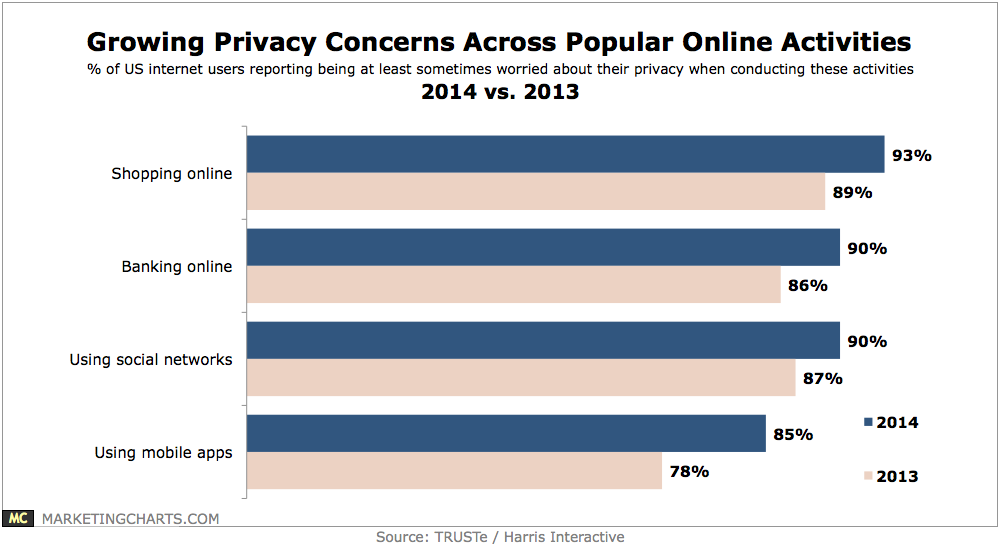
92% of American internet users report worrying about their privacy online at least sometimes, a figure that has remained consistent over the past couple of years.
Read More