Consumer Behavior
Mobile Share Of US Organic Search Visits, Q2 2012 – Q1 2014 [CHART]

Mobile’s 33% of Google search visits in Q1 2014 represented only a slight uptick from Q4 2013 (32%), but a more robust rise from 27% share during the year-earlier period.
Read MoreBroadband & Pay-TV Subscribers In 2013 [CHART]
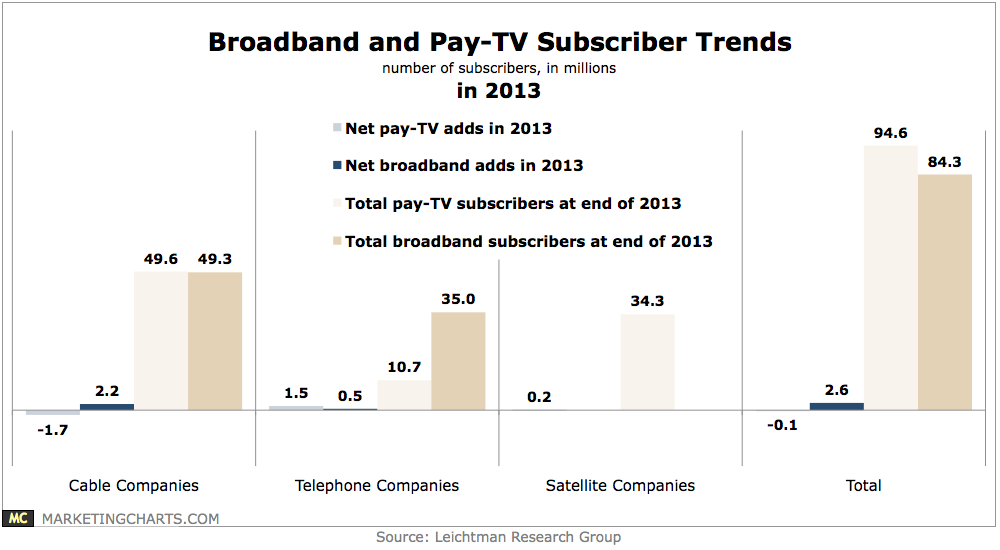
While the rate of cord-cutting slowed last year, cable companies shed almost 2 million pay-TV subscribers while adding more than 2 million broadband internet subscribers.
Read MoreMobile Germans Who Pay Favorable Attention To Ads By Device, March 2014 [TABLE]
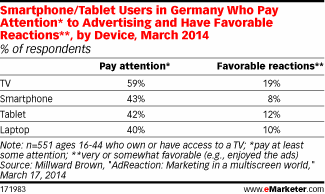
In Germany only 8% to 12% said they favored ads on a smartphone, laptop or tablet but at least 40% said they paid attention to ads on those devices.
Read MoreMobile Spanish Users Who Pay Favorable Attention To Ads By Device, March 2014 [TABLE]
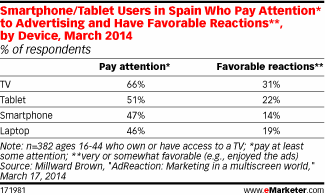
Nearly one-third (31%) of Spanish mobile users said they liked ads on TV, with the percentages for laptops and smartphones at 19% and 14%, respectively.
Read MoreFrench Mobile Users Who Pay Favorable Attention To Ads By Device, March 2014 [TABLE]
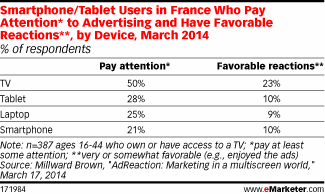
In France, 23% said they reacted favorably to ads on TV, while only 10% were well disposed to ads on their smartphones, and 9% welcomed ads on their laptops.
Read MoreInteractive Video Completion Rates Worldwide By Region, 2013 [TABLE]
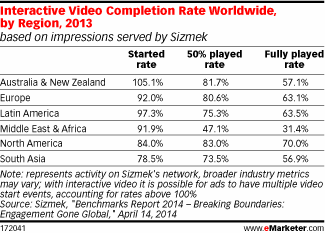
While clickthrough rates for such ads in 2013 were much lower than those for HTML5 polite video and in-stream video, at 0.17%, 0.39% and 0.60%, respectively, interactive videos did just what they set out to do: Engage those who did view them.
Read MoreLikelihood Of Acting Because Of A Mobile Marketing Message, November 2013 [CHART]
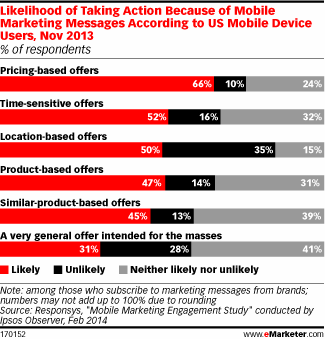
Two-thirds of mobile users who subscribed to marketing messages from brands said they were likely to take action when they saw a pricing-based offer.
Read MoreWhy People Opt-In To Mobile Marketing Messages, November 2013 [CHART]
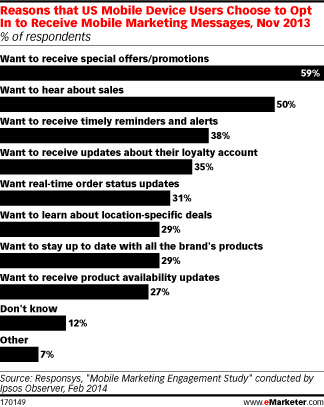
The No. 1 motivation was to receive special offers and promotions, and the No. 2 slot went to news about other sales.
Read MoreAmericans' Trust In Advertising By Demographic, April 2014 [CHART]
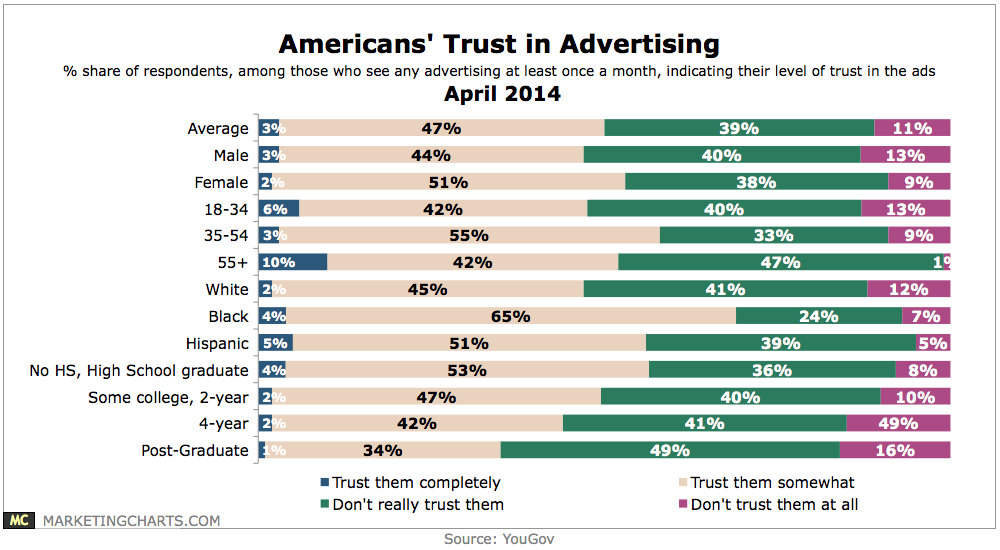
Only 3% of Americans completely trust the advertisements they see, read or hear, while 11% don’t trust them at all.
Read MoreVictims Of Stolen Personal Information By Age, April 2014 [CHART]
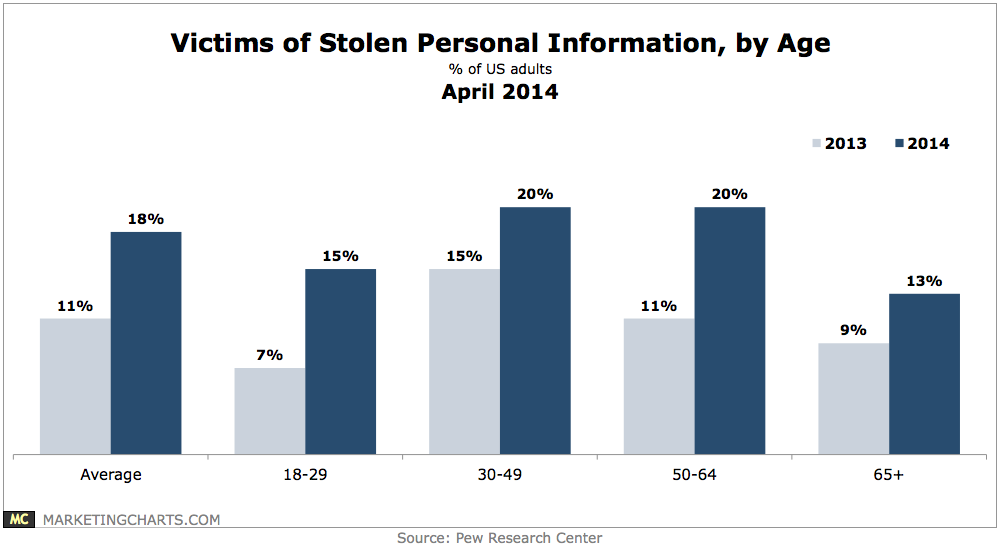
The 30-49 and 50-64 age groups appear to be among the most afflicted; 1 in 5 online adults in each group reported having their data stolen.
Read More