Consumer Behavior
Frequency With Which Parents Check Facebook, 2012-2015 [CHART]
US mother Facebookers studied checked the social network 7.4 times a day on average, vs. 5.9 times for total users.
Read MoreElements Of An Email Signature [INFOGRAPHIC]
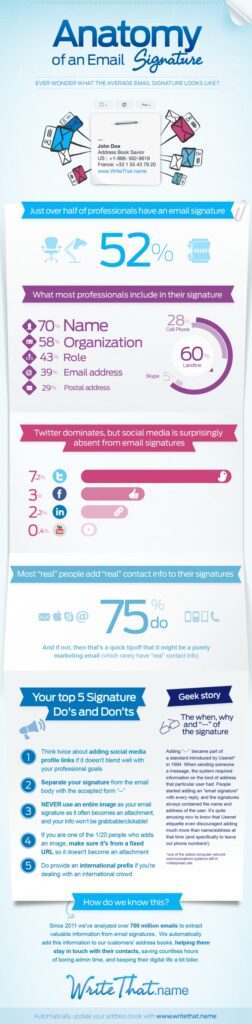
This infographic illustrates the essential elements of a professional email signature and statistics about email signature use.
Read MoreUS LGBT Media Consumption By Generation, August 2015 [TABLE]
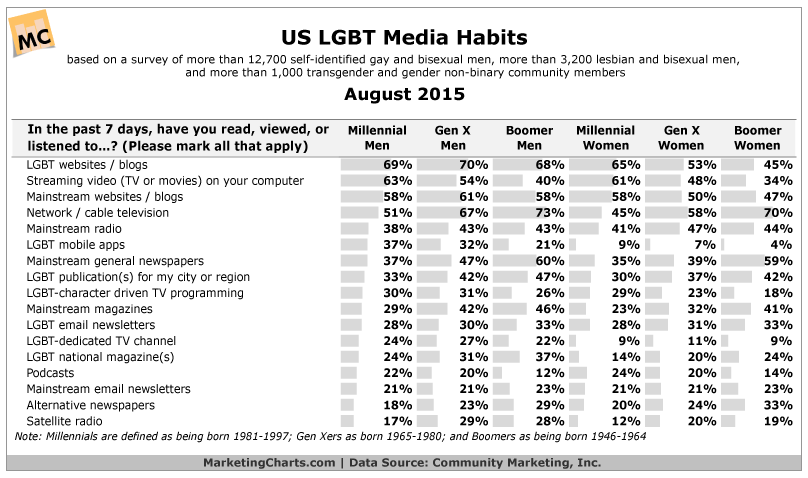
LGBT websites and blogs remain the most popular form of media among Millennial LGBTs.
Read MoreKids' Summer Media Consumption, August 2015 [CHART]
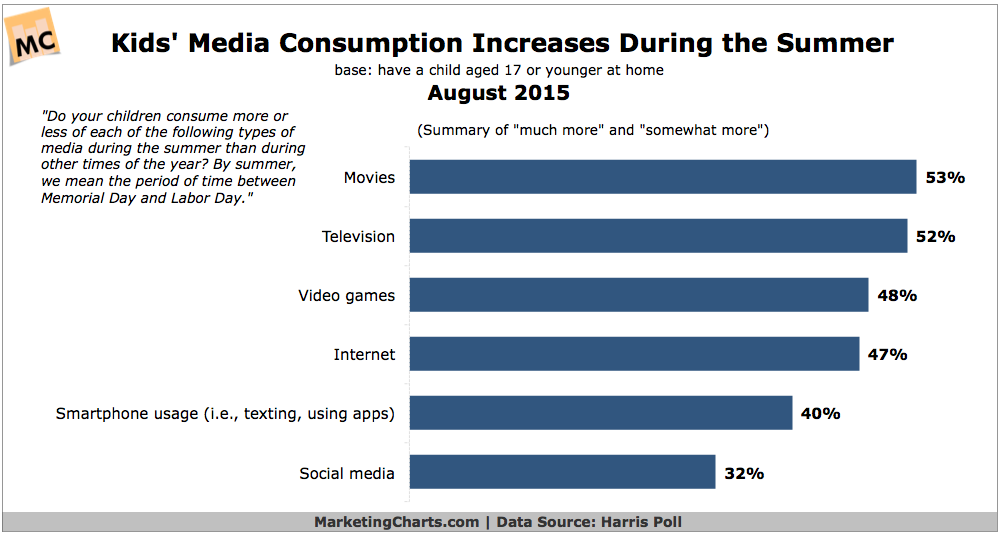
Kids’ media consumption goes up during the summer, particularly when it comes to movies and TV.
Read MoreBack to School Shopping Scheduling, August 2015 [CHART]
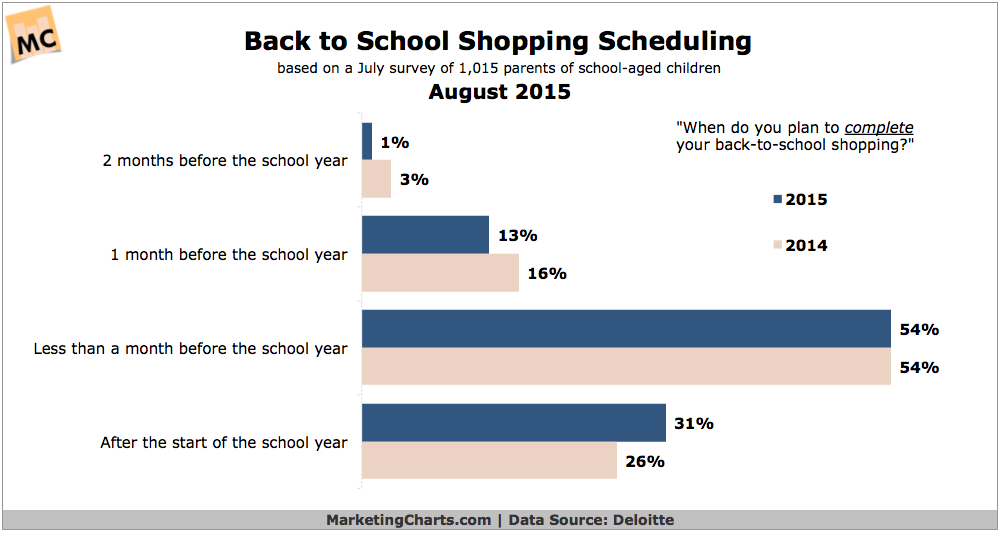
MasterCard research reminds that last year, August 29 was the heaviest shopping day of the Back To School season.
Read MoreSearch Ranking Factor Trends, August 2015 [CHART]
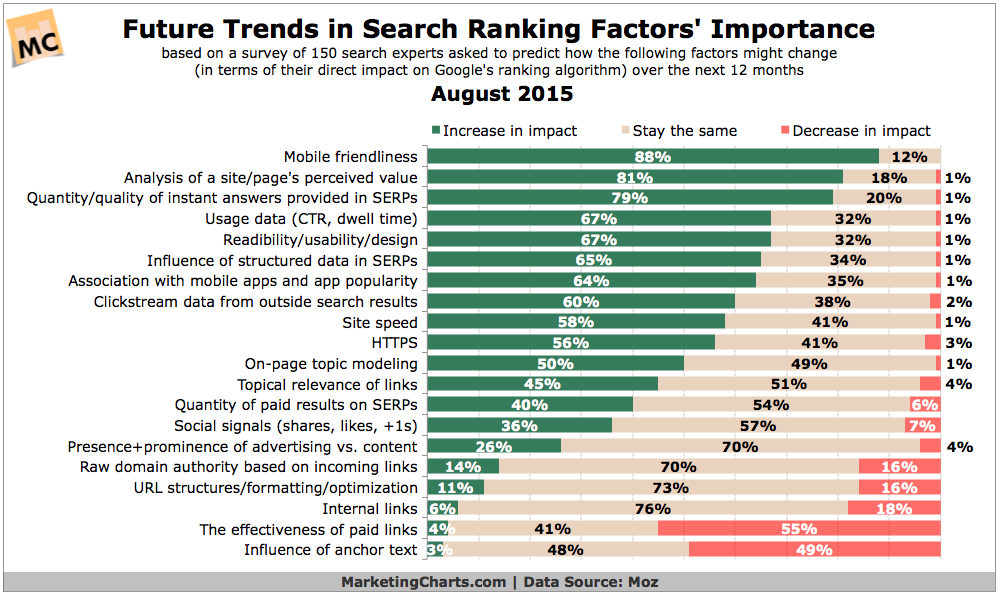
The impact of relevant content continues to grow, while the number of links to a given page remains influential though potentially decreasing in value.
Read MoreTime Spent Watching Periscope Videos Per Day, 2015 [CHART]

Periscope users watch an average of 40 years of video per day.
Read MoreDaily Active Periscope Users, 2015 [CHART]
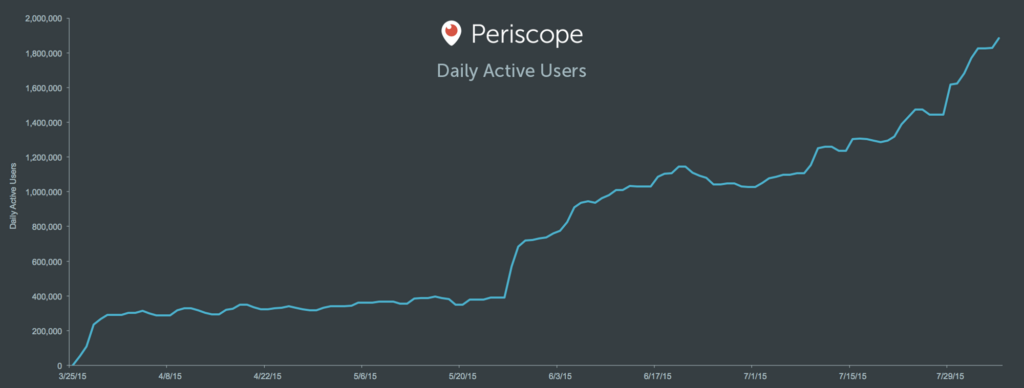
Twitter’s live video-streaming app Periscope surpassed 10 million daily active users in July.
Read MoreChief Digital Officers By Industry, 2014 [CHART]
CDOs were most common in the advertising industry, which accounted for 36% of the total last year. The media, publishing, nonprofit and retail sectors rounded out the top five.
Read MoreGlobal Growth Of Chief Digital Officer Positions, 2005-2015 [CHART]

The chief digital officer (CDO) role emerged alongside the digital transformation, and companies are rapidly making room for the position.
Read More