Video Games
Mobile Gaming Metrics Of Android & iPhone Users, December 2012 [TABLE]
iPhone users were 10 percentage points more likely than Android users to be gamers.
Read MoreTime Spent On Mobile vs. PC By Website Type, April 2013 [CHART]

This graphic from comScore illustrates time spent on the Internet using a PC vs. mobile.
Read MoreVideo Buffering Problems By Device, 2012 [CHART]
Almost 55% of online video views on iOS devices had a problem with buffering, compared to 50% of video views on Xbox, 49% on Android, and only 36% on PCs using Flash.
Read MoreThe Economic Impact Of Mapping [INFOGRAPHIC]
Google put together this infographic to illustrate some examples of the benefits of maps.
Read MoreMarketing Strategies That Are Falling Out Of Favor In 2013 [CHART]
About three in 10 marketers expect their organizations to decrease attention paid to newspapers and consumer magazines in 2013.
Read MoreVideo Games Or Gym Memberships? [INFOGRAPHIC]
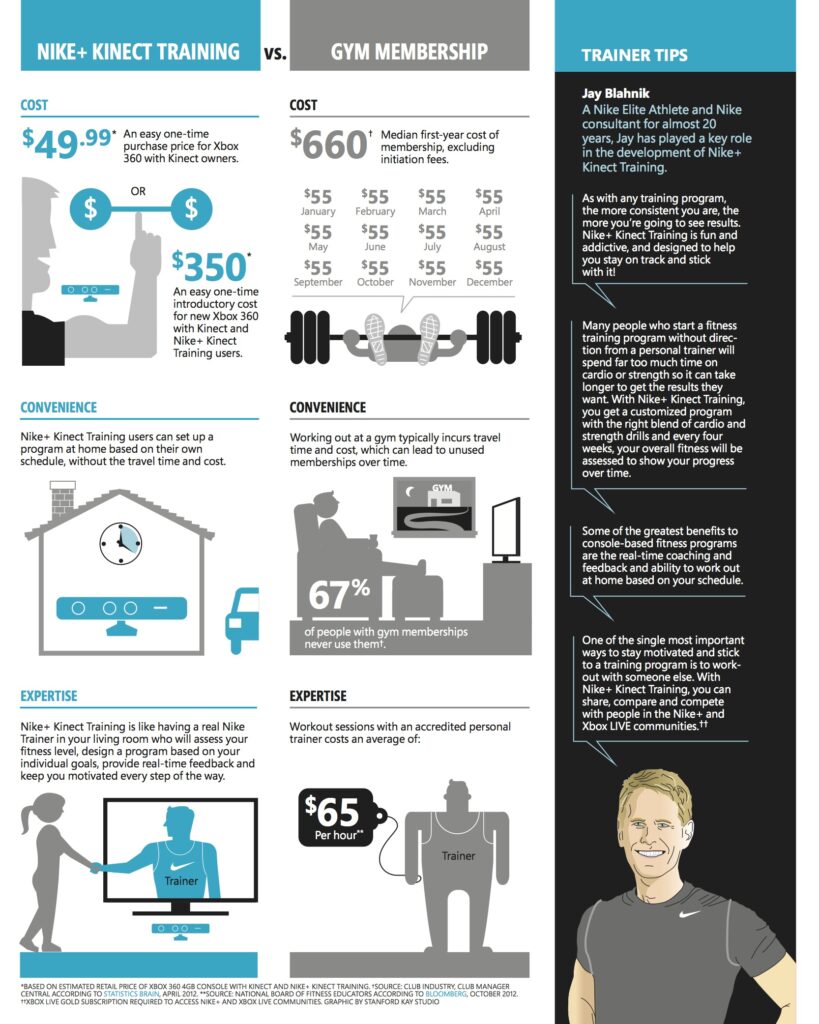
Nike+Kinect video game producers put together this infographic to illustrate the costs of working out at home by playing a video game vs buying a gym membership.
Read MoreCitizen Perceptions Of The Value Of Online & Offline Media, February 2013 [CHART]
Connected consumers in the US place more monetary value on offline media activities or products than online ones ($1,600 per year vs. $1,132).
Read MoreMarketing Channels That Are Falling Out Of Favor In 2013 [CHART]

Nearly 1 in 3 marketers plan to decrease their organization’s focus on newspapers this year.
Read More
Device Ownership Among American Households With Children, 2010 & 2012 [CHART]
Nearly all households with kids ages 0 to 8 had computers and a large majority had web-enabled phones.
Read More