Social Media Marketing
Share Of Weekly US Blog Posts vs Social Shares By Day Of The Week, April 2014 [CHART]
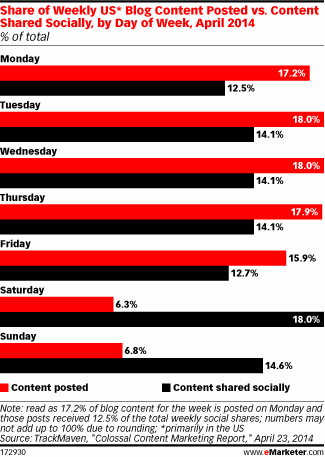
Bloggers were most likely to post their content on weekdays, with 87% of weekly blog content pushed out between Monday and Friday.
Read MoreFacebook Response Rates, Q2 2012-Q1 2014 [CHART]
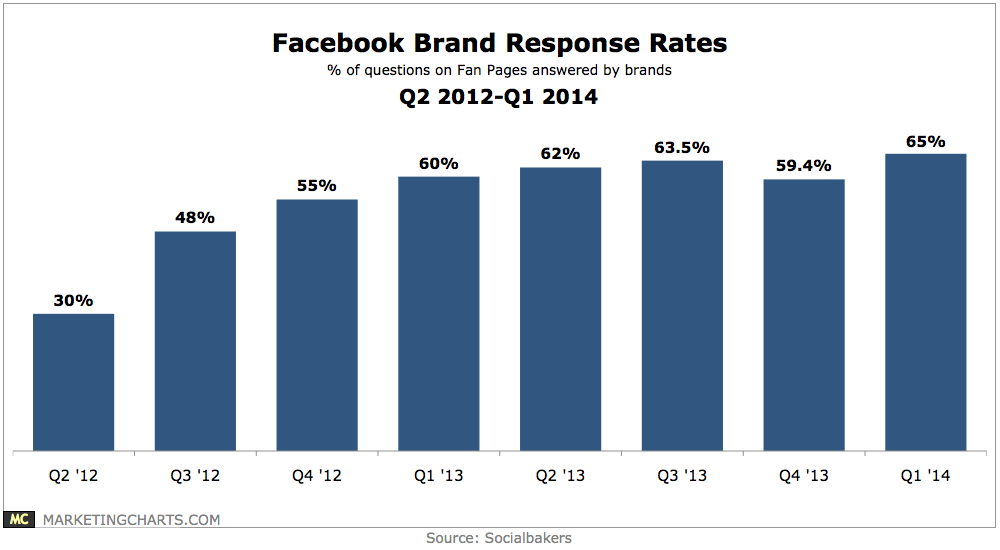
The average response rate for user wall questions asked of brands around the world on hit 65% in Q1.
Read MoreProfessional Activities Conducted On Social Media By UK Business Pros, January 2014 [CHART]
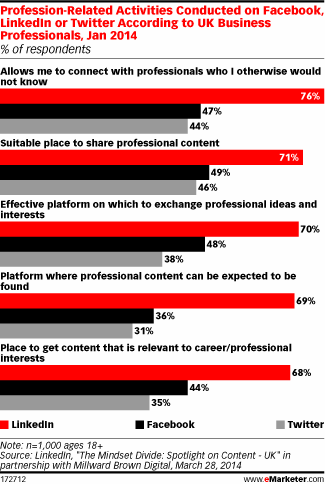
72% of UK business pros consider LinkedIn it a trustworthy source of professional content—compared with 37% for Facebook and 30% for Twitter.
Read MoreNumber Of LinkedIn Connections Among UK Business Professionals, March 2014 [CHART]
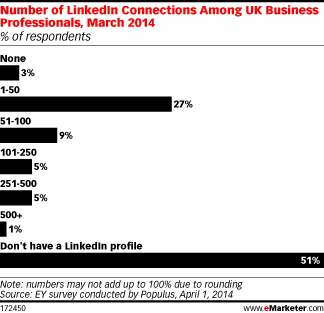
49% of UK business professionals had a LinkedIn account.
Read MoreGlobal Mobile RTB Ad Volume Share By Content Category, Q4 2013 & Q1 2014 [CHART]
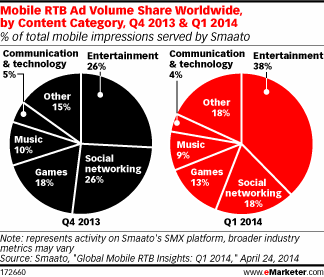
The entertainment and media industry claimed 37% of total mobile RTB ad spending on the SMX platform worldwide in Q1 2014.
Read MoreMichael Sams' Reality Show & The Weather Channel's Twitter Storm [VIDEO]

Beyond Social Media, Episode 48: Michael Sams’ ill-advised reality show, Weather Channel’s ill-advised Tweet & the Supreme Court’s ill-advised API ruling.
Read MoreCustomer Experience Leaders vs Laggards, May 2014 [TABLE]
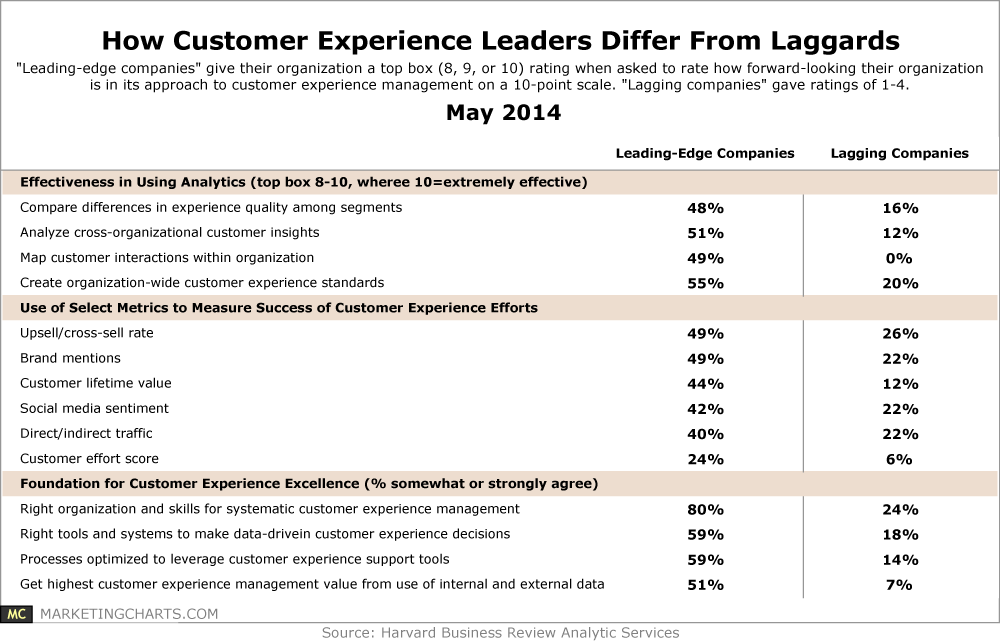
58% believe their customer retention rates are very successful (top-3 box score on a 10-point scale), versus just 20% of lagging companies who concur.
Read MoreMarketing Channels UK Consumers Prefer For Contact By Age, February 2014 [TABLE]
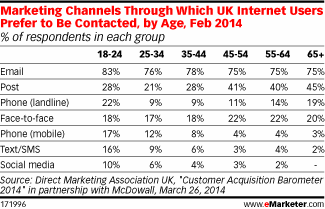
Email was the preferred marketing channel among UK internet users across all age groups.
Read MoreTypes Of Negative Social Posts About Companies, February 2014 [CHART]
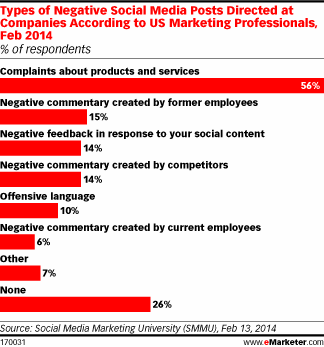
High levels of positive posts come even when nearly half of US marketing professionals are still missing a strategy for dealing with negative buzz.
Read MorePositive & Negative Brand Interactions On Social Media, Q1 2014 [CHART]
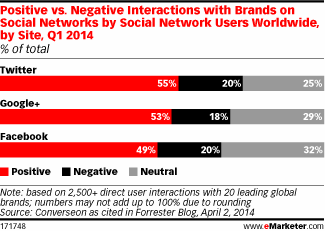
55% of interactions with brands that took place on Twitter were positive in nature, with an additional 25% neutral.
Read More