Search Engine Advertising
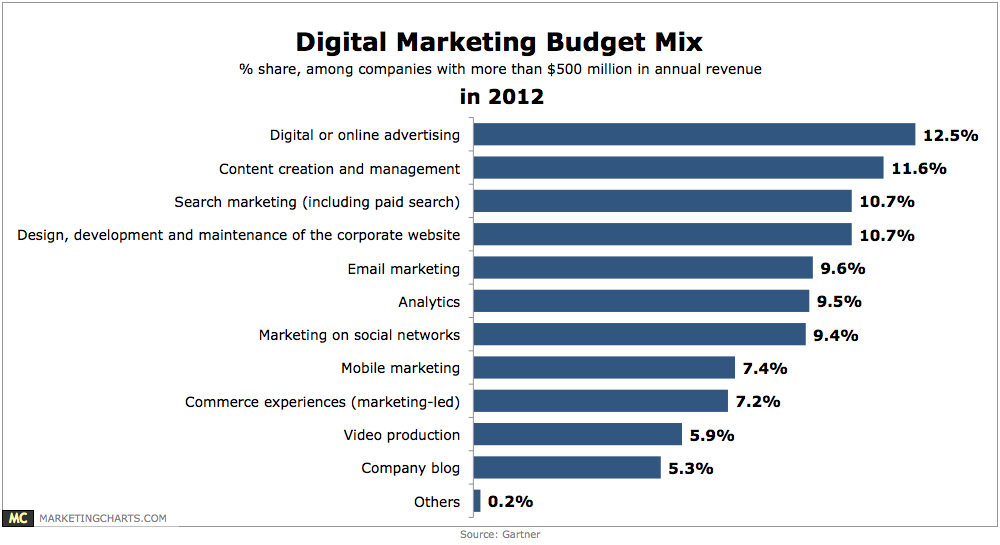
Digital Marketing Budget Mix In 2012 [CHART]
Marketers from companies with more than $500 million in annual revenue are devoting the largest portion of their digital marketing budgets to digital or online advertising (12.5%) and content creation and management (11.6%).
Read MoreSearch Engine Marketing Landscape [INFOGRAPHIC]
This infographic from LUMA Partners illustrates today’s complex search engine marketing landscape.
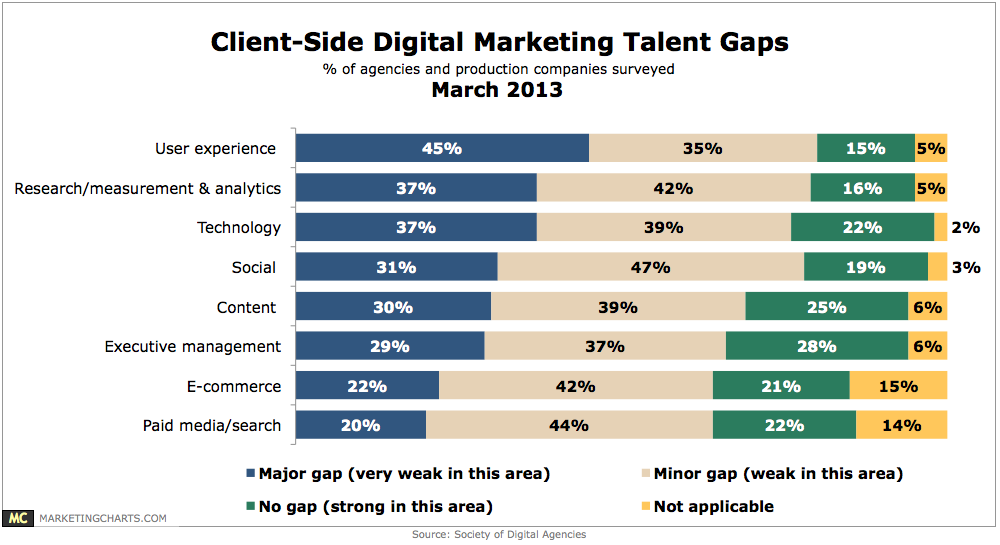
Read MoreAgency Perceptions Of Client Online Marketing Talent Gaps, March 2013 [CHART]
80% of agencies and production companies pointed to user experience (UX) as a major (45%) or minor (35%) talent gap among clients.
Read MoreTop B2B Online Marketing Activities, March 2013 [CHART]
Email (64%) is B2B marketers’ most important digital marketing activity.
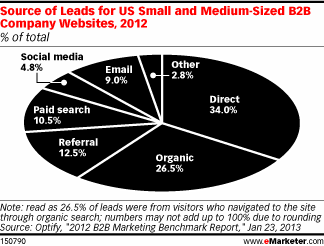
Read MoreSMB B2B Website Lead Sources, 2012 [CHART]
Despite accounting for just 1.9% of overall site traffic, social accounted for 4.8% of all B2B SMB leads—a relatively small number, but not insubstantial.
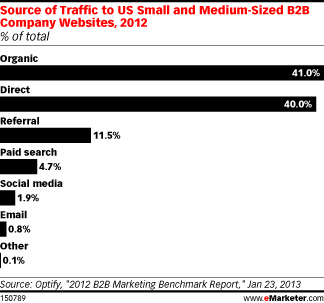
Read MoreB2B Website Traffic Sources For SMBs, 2012 [CHART]
Social remains a small part of the larger traffic picture for most of the B2B SMBs studied, accounting for 1.9% of total traffic.
Read MoreFactors Contributing To Inbound Marketing Success, February 2013 [CHART]
HubSpot has found that virtually all of its customers experienced an increase in traffic since using HubSpot, with a plurality (25.1%) attributing that increase to blogging.
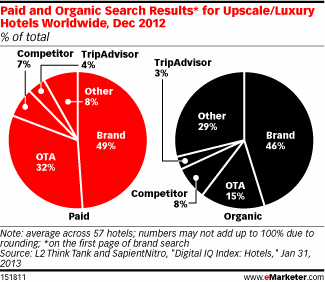
Read MoreSearch Engine Marketing Results For Luxury Hotels Worldwide, December 2012 [CHART]
46% of first-page organic search results for worldwide upscale hotel brand keywords belonged to brands themselves, as opposed to OTA sites or TripAdvisor links.
Read MoreBreakdown Of Top Brands Digital Marketing Budgets, December 2012 [CHART]
65% of top US brands reported participating in influencer marketing.
Read More