Radio Advertising
Positive Brand Impression Touchpoints [CHART]
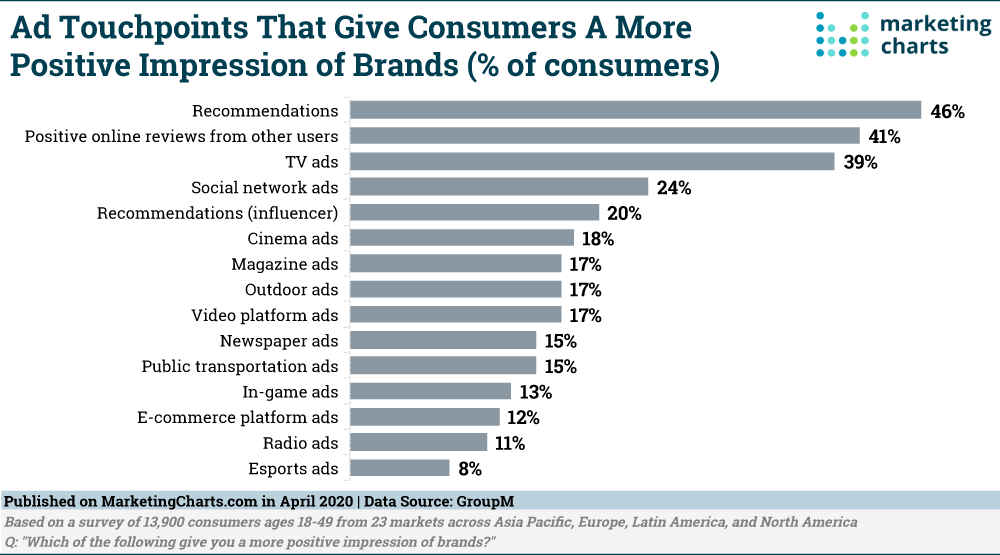
When it comes to the advertising touchpoints that give consumers the most positive impression of a brand, TV ads rule the roost among paid media.
Read MorePandemic Pauses Ad Budgets For 2020
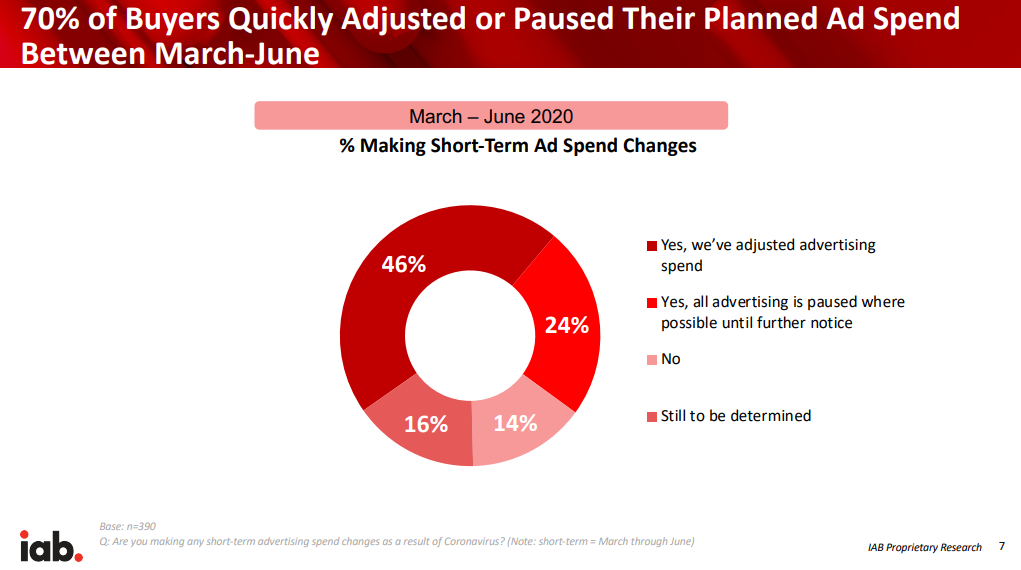
IAB research found that nearly a quarter of marketers have paused all advertising spending through the second quarter. Another 46% are reducing their budgets.
Read MoreAds Ignored By Podcast Listeners [CHART]
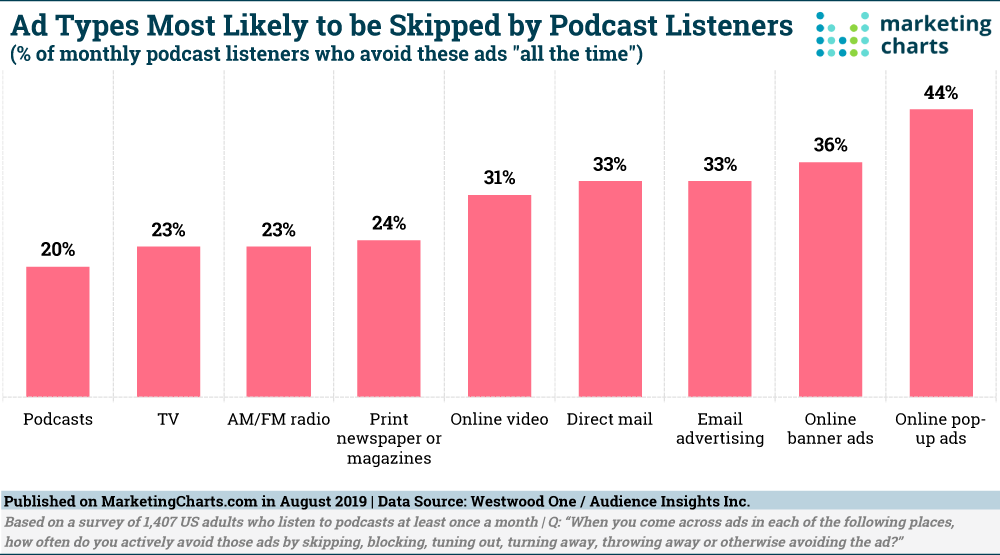
In the past two years, US podcast advertising revenues have more than doubled, with spend expected to reach an estimated $678.7 million in 2019.
Read MorePolitical Ad Spending By Media, 2020 [CHART]
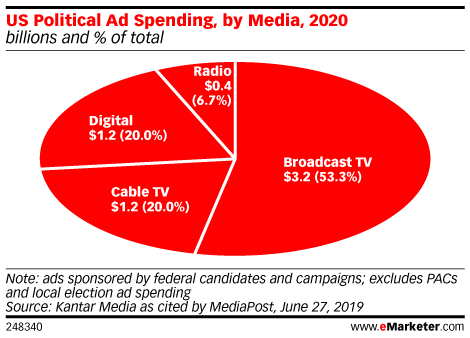
Of the $6 billion in political campaign spending this cycle, Kantar expects 20%, or $1.2 billion, to go to digital. TV still wins the lion’s share of campaign budgets, with almost three-quarters of the total split between broadcast and cable TV.
Read MoreAd Spending By Media & Format, 2018-2019 [TABLE]
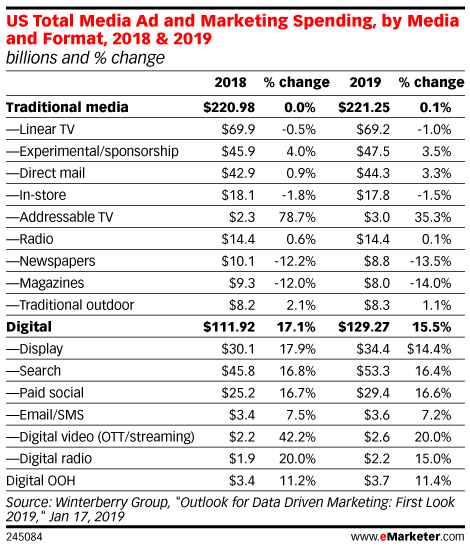
Ad spend on over-the-top (OTT) streaming video will increase 20% this year to $2.6 billion, according to a Winterberry Group study of US ad spend data.
Read MorePodcast Discovery Channels [CHART]
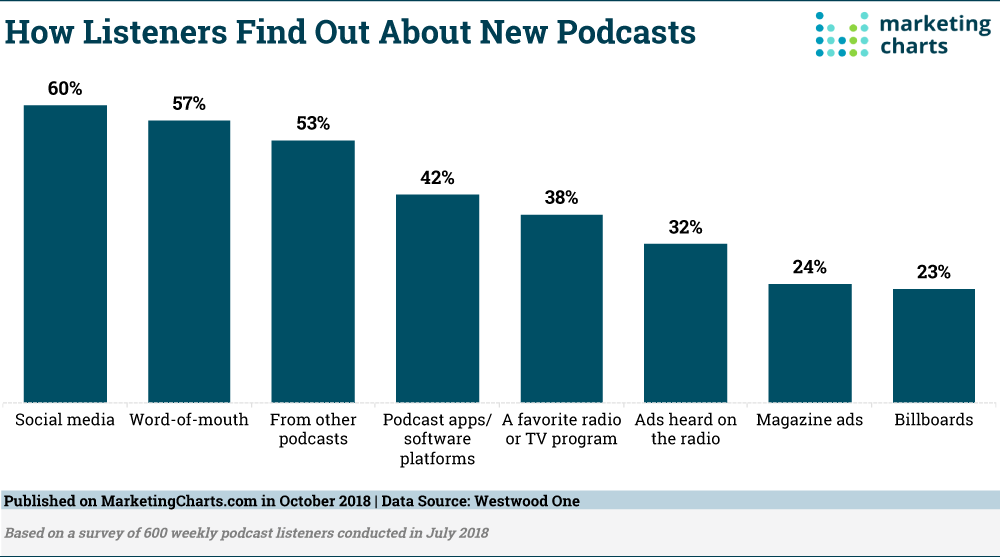
The podcast audience is growing, and people are becoming heavier listeners over time.
Read MoreAd Spending By Media Channel, 2020 [CHART]
This year, mobile will surpass TV ad spending by more than $6 billion, according to our latest ad spending forecast. By 2020, the channel will represent 43% of total media ad spending in the US—a greater percentage than all traditional media combined.
Read MoreProgrammatic Advertising Channels [CHART]
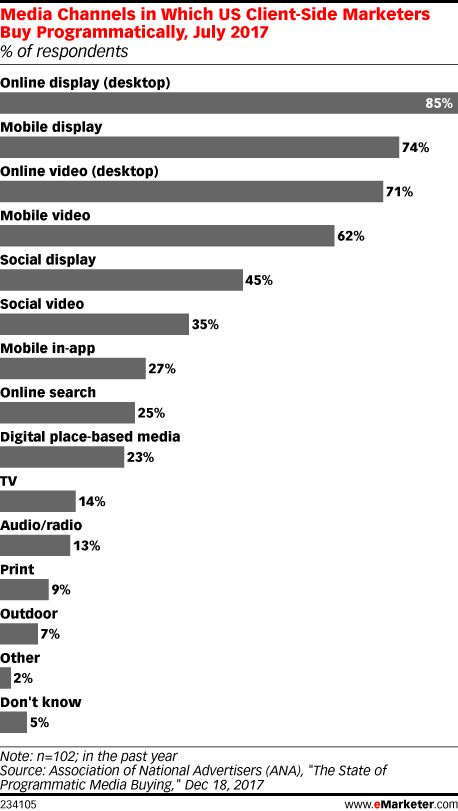
Compared with other ad formats sold through automation, programmatic audio has been slow to catch on. A host of factors have held back programmatic audio, some associated with audience and spending patterns, but many tied to technical issues.
Read MoreAd Spending Share By Media, 2018 & 2022 [CHART]
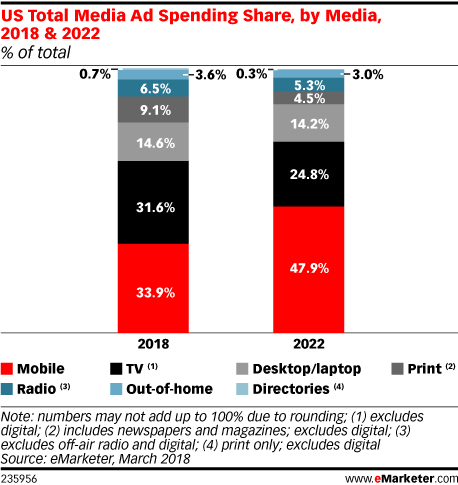
With a 33.9% share of total US ad spend, mobile will pass TV as the leading advertising medium in the world’s largest ad market—and we expect that share will grow to a whopping 47.9% by 2022.
Read MoreApp Install Ad Budget Allocations [TABLE]
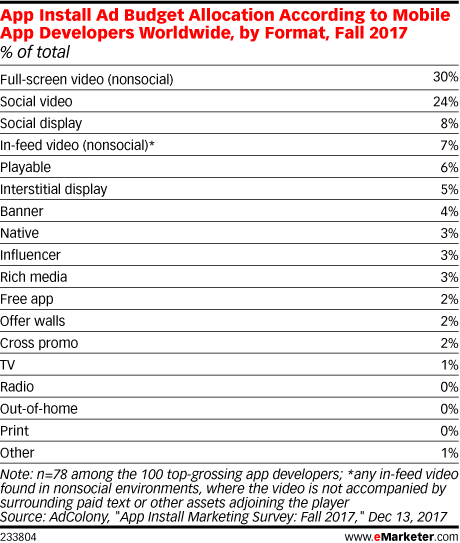
Mobile app developers worldwide were directing the majority of their install marketing budgets to video. When added together, various types of video made up 61% of app install budget allocation in fall 2017.
Read More