Online Behavior
Bad Shopping Experience Reactions [CHART]
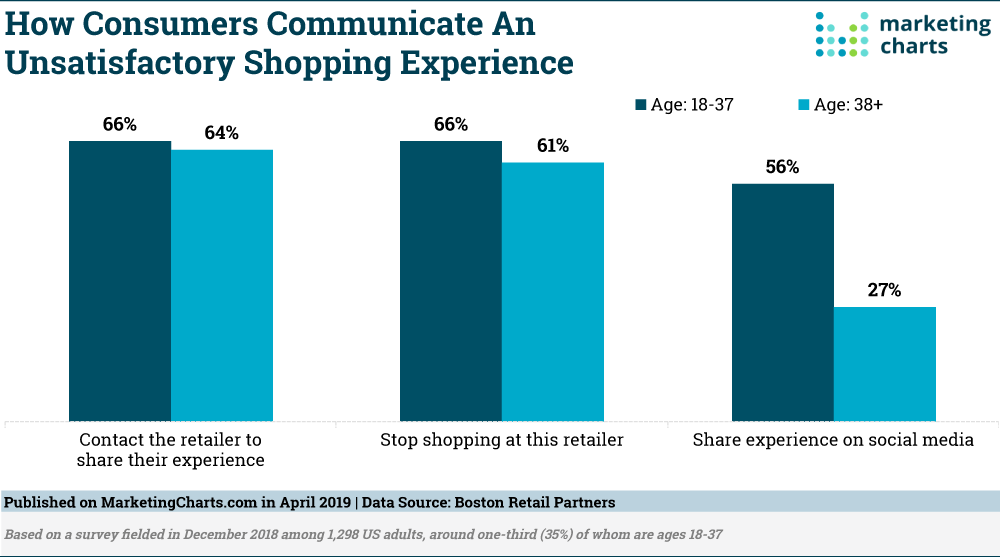
A report from BRP shows that there are significant variances in shopping behavior by age, in particular between those who grew up in the internet age (“Digital Consumers” age 18-37) and those born before this time (“Traditional Consumers” age 38+).
Read MoreFood Delivery App Users, 2018-2023 [CHART]
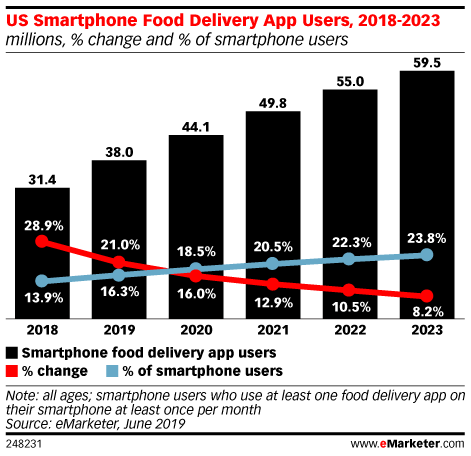
Food delivery apps are rapidly growing in popularity, according to eMarketer’s latest forecast on mobile app usage. This year, these apps will be used by 38.0 million people in the US, up 21.0% over 2018. By 2021, more than 20% of US smartphone users will use a food delivery app.
Read MoreOnline Shoppers' First Destination [CHART]
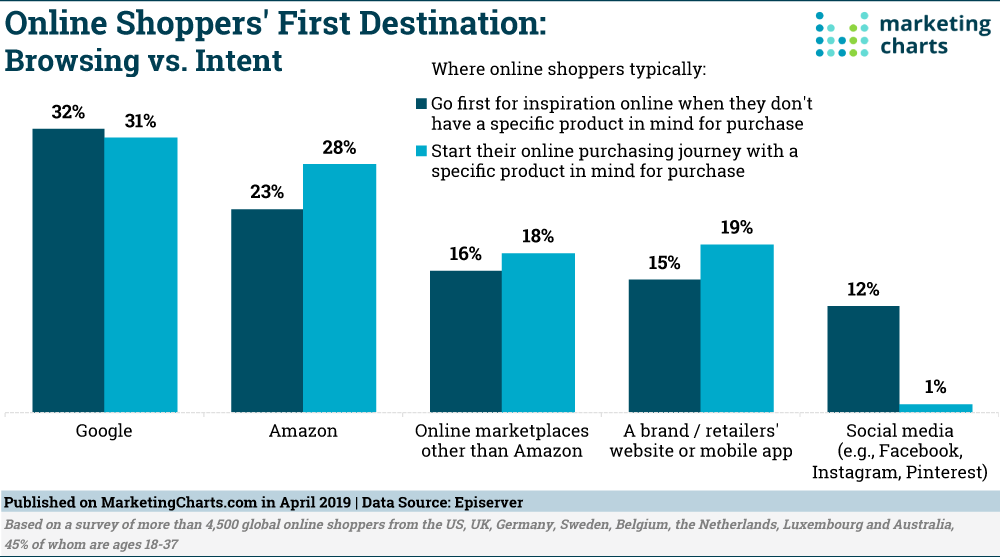
Three-quarters of online shoppers say their online purchases are largely pre-planned (20% say they’re all pre-planned, 55% say many are pre-planned).
Read MoreAmazon Search Depth [CHART]
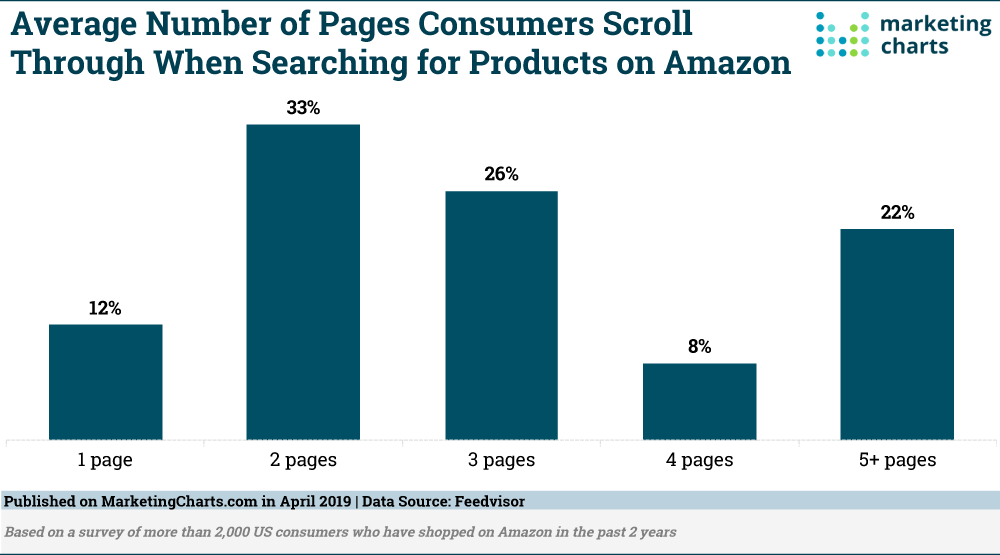
One of the benefits of Amazon is that a shopper is rarely starved for choice. Yet, despite being presented with pages of options during a search, almost half (45%) of shoppers say they typically don’t scroll past the second page of results, per a report from Feedvisor.
Read MoreLate Night Parental Behavior [TABLE]
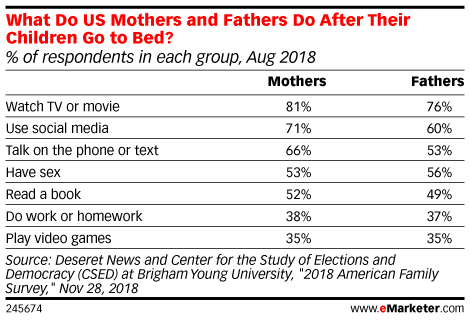
The No.1 post-bedtime activity for both mothers and fathers is watching TV or movies, according to a survey by Brigham Young University and Deseret News.
Read MoreSocial Media Activities By Platform [PODCAST]
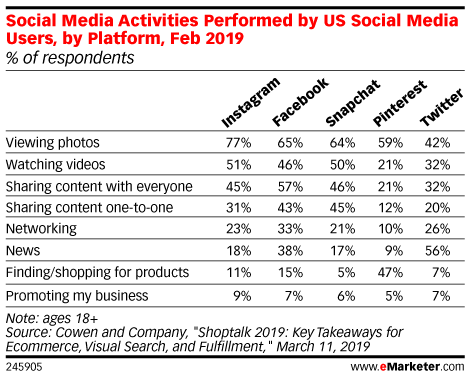
In this episode of ‘Behind the Numbers,’ eMarketer principal analyst Debra Aho Williamson discusses where people share content and how these changes could affect marketers.
Read MoreAmazon's Challenge To Apple's AirPods = More Time For Content
Amazon is planning to challenge Apple in the wireless earbud market. If Amazon is successful, it will free up a great deal more of consumers’ time that they will fill with content consumption.
Read MoreMillennials' Response To Video Marketing [CHART]
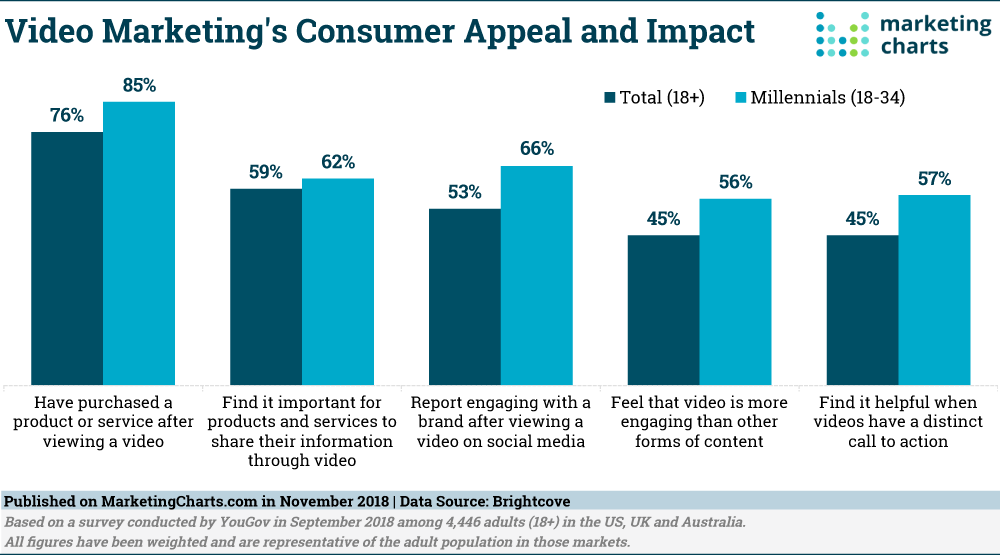
Fully three-quarters (76%) of the almost 4,500 adults surveyed in the US, UK and Australia report having made a purchase after viewing a marketing video.
Read MoreWhy Customers Abandon Feedback Surveys [CHART]
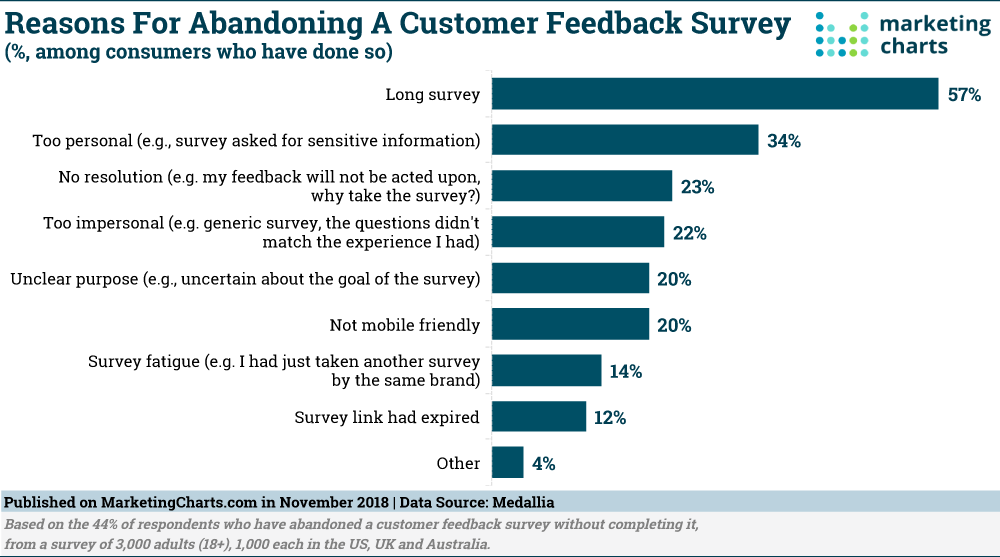
Some 44% of consumers across the US, UK and Australia say they’ve abandoned a customer feedback survey without completing it, according to a recent study from Medallia.
Read MoreGeneration V's Favorite Social Platforms, 2015-2018 [CHART]
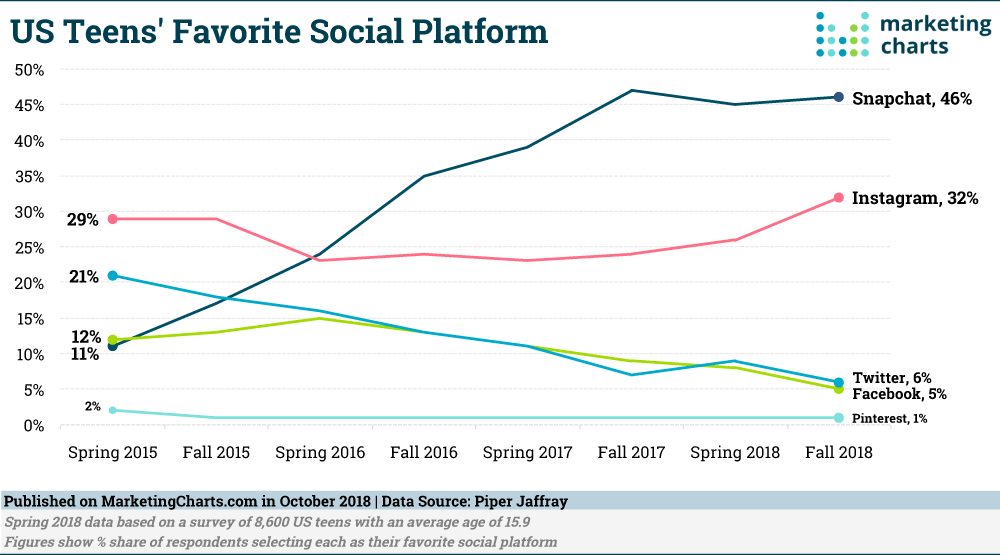
Snapchat has reigned supreme as teens’ favorite social platform for a couple of years now, according to Piper Jaffray’s semi-annual teen surveys.
Read More