Online Behavior
Top 10 Brands Among American Men & Women By Social Chatter [TABLE]
Women are significantly more likely than men to discuss brands on social media sites.
Read MoreTop 10 TV Programs & Events By Social Chatter [TABLE]
The number of social conversations about TV on several leading social sites rose from just over 10 million in June 2011 to over 81 million by June 2012.
Read MoreMaximizing Tweets [INFOGRAPHIC]

Fusework Studios created this infographic based on Buddy Media’s Strategies for Effective Tweeting: A Statistical Review.
Read MoreMobile Phone Use For TV Content By Generation [CHART]
32% of cell owners used their mobile devices to find television-related content.
Read MoreCell Phones As A Distraction From TV By Generation [CHART]
38% of adult cell owners reported using their mobile device to keep themselves occupied during commercials or other breaks in a program.
Read MoreDemographics Of Cell Phone Owing TV Viewers [TABLE]
Half of all adult cell owners (52%) have used their phones recently for engagement, diversion, or interaction with other people while watching TV.
Read MoreB2B Email Marketing Dayparting [INFOGRAPHIC]
44% of B2B marketers say sending emails on Tuesday results in better open rates.
Read MoreEmail Click Rates By The Hour [CHART]
Email messages scheduled as the work day begins and progresses see a marked decline in click rates, with rates not picking up again until the afternoon, before peaking overnight.
Read More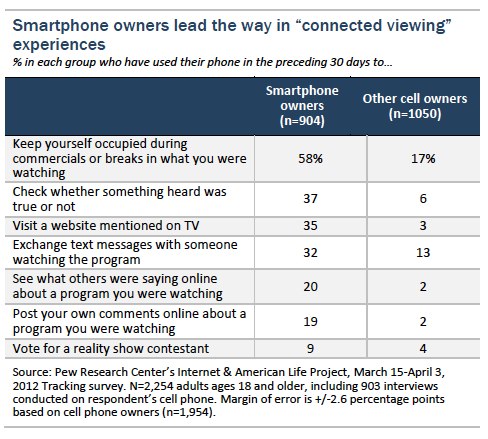
Search Visibility & Brand Value [CHART]
Search rankings can have a significant effect on brand awareness, as well as a consumer’s perception of a brand and subsequent purchase consideration.
Read More