Online Behavior
Devices Used By Luxury Goods Buyers, April 2013 [CHART]
Luxury buyers used an average of 3.1 digital devices, compared with 2.9 devices for the general population.
Read MoreLuxury Goods Buyers' Daily Media Consumption, April 2013 [CHART]
Among those with an annual household income of at least $100,000 who had purchased at least two luxury items in the past two years—98% went online daily.
Read MoreGlobal Ad Spending Growth By Medium, 2012-2015 [CHART]

Between 2012 and 2015, online ad spending should increase by $47.6 billion, or about two-thirds of the $71.7 billion in projected growth.
Read MoreConcern Over Risks Of Social Media Use, September 2013 [CHART]
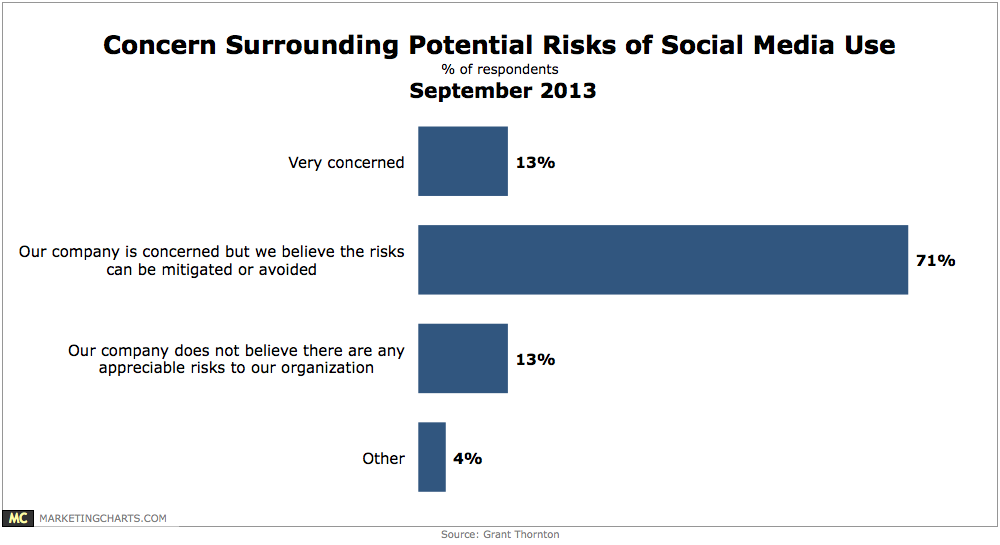
71% of respondents indicated their company is concerned with the potential risks of social media use but they believe the risks can be mitigated or avoided.
Read MoreAmericans Who Use Health Apps, September 2013 [CHART]
More than one-quarter of American Internet users reported having health-related apps and turning to them at least sometimes.
Read MorePay TV Subscribers By Channel & Age, June 2013 [TABLE]
Seventy percent of respondents shelled out for cable TV, while only 41% splurged on Netflix.
Read MoreTop Sites Used To Watch TV, June 2013 [CHART]
More than six in 10 respondents said they relied on Netflix to watch shows.
Read MoreImportance Of Original Programs When Choosing A Streaming Video Service, June 2013 [CHART]
63% of US internet users said that an offer of original content was at least somewhat important in influencing their decision to select a particular subscription service.
Read MoreAdvertisers' Spending Plans By Medium, September 2013 [CHART]
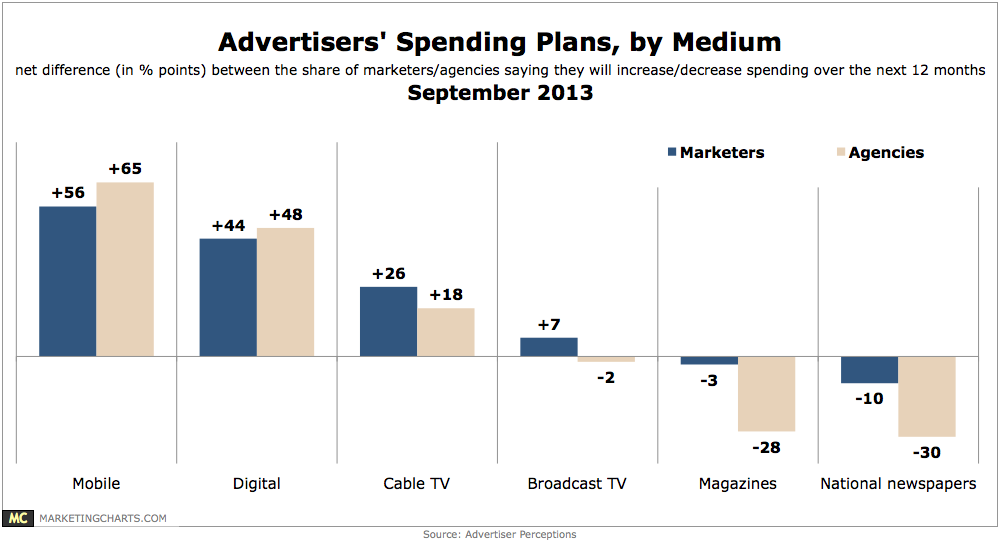
Enthusiasm for cable TV spending is high, with the share of respondents saying they plan to increase ad spending on cable TV outweighing the share indicating they’ll decrease spending.
Read More